Download
1 / 28
280 likes | 299 Vues
This study investigates undergraduate persistence and graduation rates from Fall 2003 through Fall 2010/Spring 2011 using leading indicators to analyze milestone attainment and degree completion among diverse student populations. Key findings highlight the impact of milestone satisfaction on six-year graduation rates. The study identifies detailed variability in both milestone attainment and graduation rates, offering insights into interventions to improve outcomes, particularly for low-income and underrepresented minority students. The report outlines strategies to reduce attainment gaps and enhance overall institutional graduation rates.

E N D
Undergraduate Persistence & 6yr Graduation Rates: Fall 2003 through Fall 2010/Spring 2011
Persistence of All 1st Time Freshmen 1st Fall to Spring, and 1st Fall to 2nd
Persistence of Classified Full-Time Freshmen 1st Fall to Spring, and 1st Fall to 2nd
Persistence of All Classified Undergraduates Fall to Fall, Fall 2006 and Fall 2007
Persistence of All Classified Undergraduates Fall to Fall, Fall 2008 and Fall 2009
Persistence of All Classified Undergraduates Fall to Fall, Fall 2010 ?
Freshman 1st year Departers Last Semester and Cumulative GPA Academic Standing
Leading Indicators Project Review & Discussion: Looking at Milestone Attainment and Degree Completion among the Freshman Cohorts 2003, 2004, 2005
Educational Trust “Leading Indicators” • Provides framework for investigating and understanding variable student graduation rate outcomes specifically with respect to those student’s attainment of specified milestones within the 1st academic year. • The basic framework includes demographic breakouts by ethnicity, low-income status, and FT/PT status. • 1st Academic Year Milestones include: • Completion of 80% or more attempted credit hrs with C or better. • Completion of minimum 24 credit hrs • Attempt College Level Math • Complete College Level Math C or better • Attempt English Composition • Complete English Composition
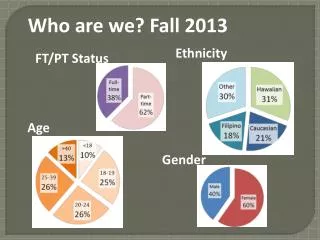
Customizing the Leading Indicators Framework • Localized ethnicity sub populations. • Ascertained pell status from any enrolled term, not just 1st Fall. • Ascertained student milestone attainment looking across all system campuses and inclusive of summer semesters immediately prior and subsequent 1st Fall. • Ascertained 6 yr degree completion looking separately for 4 yr degrees earned from Hilo campus, UH system, & outside UH system. • Based on existing research/insights…Worked with 5 additional variables within the cohort: gender, residency, any summer enrollment behaviors, any change of major behaviors (by change type direction & magnitude)
Key Findings: of 1,327 Freshmen, the percentage satisfying milestones within their 1st academic year enrolled
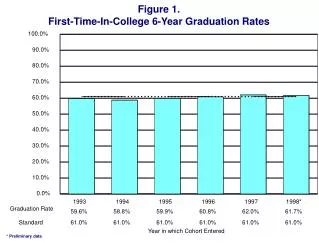
Key Findings: Of those satisfying each milestone, the percent graduating within 6 years
Key Findings: Of those NOT satisfying each milestone, the percent graduating within 6 years
Key Findings: Of those satisfying all milestones in the 1st year, the percent graduating within 6 years
Key Findings: Of those satisfying NO milestones in the 1st year, the percent graduating within 6 years
Interventions:Interpretations • Since Leading Indicators milestone attainment correlates favorably with graduation, • And The Education Trust’s intention is to increase degree attainment among Low Income students and under-represented minorities… • Action plan is that encouraging “good behaviors” through focused institutional interventions can improve milestone attainment and degree completion for Low Income and under-represented minorities specifically. • Such interventions in turn, benefit overall institutional milestone attainment and graduation rates.
To Reframe the Challenge,How Might We: • Reduce milestone attainment gaps between general (sub) population and Low Income and under-represented minority populations by half ? (A2S goal=Access to Success) • Reduce degree attainment gaps between general (sub) population and Low Income and under-represented minority populations by half—institutional grad rates and/or overall ? (A2S goal=Access to Success) When… • Low Income Hilo grad rate is 1.8% higher than general population & Overall grad rate is 3.4% lower. Also, their Hilo grad rate is 2.9% higher than Non Pell, & 5.4% lower overall. • Under-represented minority Hilo grad rate is 5.6% lower than general population & Overall grad rate is 13.2% lower. Also, their Hilo grad rate is 11.8% lower than Non “URM”, & 25.2% lower overall.
Follow Through… • Identify those sub population milestone and degree attainment gaps that most warrant direct attention • Identify further institutional intervention strategies • Identify further research questions needed for effective action