DATA COLLECTION
380 likes | 394 Vues
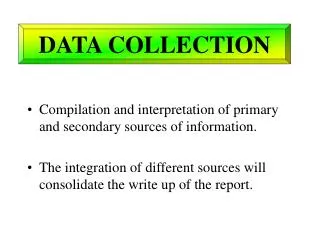
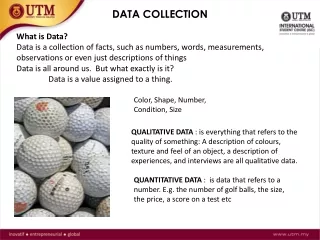
DATA COLLECTION. What is Data? Data is a collection of facts, such as numbers, words, measurements, observations or even just descriptions of things Data is all around us. But what exactly is it? Data is a value assigned to a thing. Color, Shape, Number, Condition, Size.

DATA COLLECTION
E N D
Presentation Transcript
DATA COLLECTION What is Data? Data is a collection of facts, such as numbers, words, measurements, observations or even just descriptions of things Data is all around us. But what exactly is it? Data is a value assigned to a thing. Color, Shape, Number, Condition, Size QUALITATIVE DATA : is everything that refers to the quality of something: A description of colours, texture and feel of an object, a description of experiences, and interviews are all qualitative data. QUANTITATIVE DATA : is data that refers to a number. E.g. the number of golf balls, the size, the price, a score on a test etc
Categorical Data : puts the item you are describing into a category: For example, the condition “used” would be categorical and also categories such as “new”, “used”, ”broken” etc Discrete Data : is numerical data that has gaps in it: e.g. the count of golf balls. There can only be whole numbers of golf ball (there is no such thing as 0.3 golf balls). Continuous Data : is numerical data with a continuous range: e.g. size of the golf balls can be any value (e.q. 10.53mm or 10.54mm but also 10.536mm). In continuous data, all values are possible with no gaps in between. Primary Data Secondary Data
From Data to Information to Knowledge Data, when collected and structured becomes more useful and meaningful.
DATA PhD WISDOM MSc KNOWLEDGE BSc INFORMATION
LINEAR MODEL FOR RESEARCH PROCESS Testing validity Intrepetation Data Collection Sampling Operationalization Hypothesis Theory
Data Collection Techniques Observations, Tests, Surveys, Document analysis Experiments
Basic Issues • Main questions: * Study objectives? * What is being investigated? * Attributes & variables involved? * Variable measurement? * Method of data collection? • Main problems with data: * Sufficient amount but irrelevant * Relevant but insufficient * Too much data, some useless • Implications: * Waste of resources * Loose analysis * Non-fulfilling objectives * Unresolved research questions * Lack of quality thesis
Determining Data • Research issue, objectives, hypotheses? * Maintaining the “thesis” * What are involved in maintaining your idea, testing hypotheses, etc. * What “answers” to be required • In what way research issue is to be operationalised? * What cause-and-effect phenomenon to be explained? * What variables are involved? * What data required for the variables? * How to measure them? • Types of data * Primary * Secondary * others
Principles of Data Collection • Understanding and knowing what types of data required • Collect only relevant data • Determine methods of data collection * Survey/questionnaire * Observation, participatory * Standard instruments * Content analysis, etc • Where, who, how, and when to collect * Research design * Sampling procedure * Prepare field work schedule/data plan * Conduct preliminary investigation • Assess situation and prepare further strategies
Instrumentation • A process of selecting and developing research tool for the purpose of data collection • Examples of instrument: * Questionnaire * Interview checklist * Observational form * Attitude/view scale * Content analysis form * Researcher-designed achievement test * Field Tools and equipments • Depends on method of study
Important aspects of instrumentation • Reliability: can it produce consistent results? • Validity: can it fulfill the required function? • Feasibility: can it fulfill the need of the researcher→ Reliable? Valid? • Calibration needed
Questionnaire • Crystallise research issue and objectives • List specific questions, the issue & objectives • Identify & list key words and their relationships • Identify cause-and-effect explanation by relating all the keywords • Identify how to operationalise the issue * define concepts * identify variables * variable measurement • Construct questionnaire table * Related questions that address issue & objectives
Secondary Data • Secondary data – data someone else has collected
Secondary Data – Examples of Sources • District health departments • Vital Statistics – birth, death certificates • Hospital, clinic, school nurse records • Private and foundation databases • Federal and State governments • Surveillance data from state government programs • Federal agency statistics • Dept of Environment
Secondary Data – Limitations • When was it collected? For how long? • May be out of date for what you want to analyze. • May not have been collected long enough for detecting trends.
Secondary Data – Limitations • Is the data set complete? • There may be missing information on some observations • Unless such missing information is caught and corrected for, analysis will be biased.
Secondary Data – Limitations • Are there confounding problems? • Sample selection bias? • Source choice bias? • In time series, did some observations drop out over time?
Secondary Data – Limitations • Are the data consistent/reliable? • Did variables drop out over time? • Did variables change in definition over time?
Secondary Data – Limitations • Is the information exactly what you need? • In some cases, may have to make certain adjustments to suit your data requirements. Are they reliable? Is there correlation to what you actually want to measure?
Secondary Data – Advantages • No need to reinvent the wheel. • If someone has already found the data, take advantage of it.
Secondary Data – Advantages • It will save you money. • Even if you have to pay for access, often it is cheaper in terms of money than collecting your own data.
Secondary Data – Advantages • It will save you time. • Primary data collection is very time consuming.
Secondary Data – Advantages • It may be very accurate. • When especially a government agency has collected the data, incredible amounts of time and money went into it. It’s probably highly accurate.
Secondary Data – Advantages • It has great exploratory value • Exploring research questions and formulating hypothesis to test.
Primary Data • Primary data – data you collect directly from source
Primary Data - Examples • Surveys • Focus groups • Questionnaires • Personal interviews • Experiments and field study
Primary Data - Limitations • Do you have the time and money for: • Designing your collection instrument? • Selecting your population or sample? • Pre-testing/piloting the instrument to work out sources of bias? • Administration of the instrument? • Entry/collation of data?
Primary Data - Limitations • Uniqueness • May not be able to compare to other populations
Primary Data - Limitations • Researcher error • Sample bias • Other confounding factors
Precision versus accuracy "Precise" means sharply defined or measured. "Accurate" means truthful or correct.
Accurate Not precise Both Accurate and Precise Not accurate But precise Neither accurate nor precise
DATA PhD WISDOM MSc KNOWLEDGE BSc INFORMATION
The Data Equation Oceans of Data Ocean Biodiversity Informatics, Hamburg 29 Nov 2004
The Data Equation Rivers of Information Ocean Biodiversity Informatics, Hamburg 29 Nov 2004
The Data Equation Streams of Knowledge Ocean Biodiversity Informatics, Hamburg 29 Nov 2004
The Data Equation Drops of Wisdom & Understanding Ocean Biodiversity Informatics, Hamburg 29 Nov 2004