Download
1 / 27
280 likes | 502 Vues
Operation Management (OM) Introduction. Ing.J.Skorkovský , CSc , Department of Corporate Economy FACULTY OF ECONOMICS AND ADMINISTRATION Masaryk University Brno Czech Republic. Coordinates ( it is a part of OM Intro presentation as well). Lecturer : Ing.Jaromír Skorkovský, CSc .

E N D
Operation Management (OM) Introduction Ing.J.Skorkovský, CSc, Department of Corporate Economy FACULTY OF ECONOMICS AND ADMINISTRATION Masaryk University Brno Czech Republic
Coordinates(itis apart of OM Intro presentationas well) • Lecturer :Ing.Jaromír Skorkovský,CSc. • Department of Corporate Economy (5th floor) • miki@econ.muni.cz • +420 731113517 • Study material : will be updated regularly after every lesson (is.muni.cz) • So far there is lot of material there but mind you that nearly every part will be slightly or more heavily modified this year. So the correct material will have at the end of its name specification …2018mmdd e.g. 20180917 if not specified otherwise in advance • Attendance : seminar and lectures are obligatory – see subject specification (is.muni.cz) – first important condition to be admitted to exam) • Excuses : if serious reason emerges- only written from is accepted • Seminar work : will assigned after some theory will be presented. Accepted seminar work is the second condition to be admitted to exam. Assign time :1.11.2018 • Tuition plan : at the end of this slide show • Name of the tuition plan file : Tuition plan for both groups AOMA and AOPR_20180808 • Locations : AOPR : P104 and VT206, AOMA :VT206 if not specified otherwise
Whatisgoing on ? Use of Operations Management (OM) in external environment (main target) General knowledge of OM methods acquired at university and long-standing experience Knowledge of methods and experience from research and literature - teachers Knowledge of methods and experience from outside world – consultants, managers,… Extent of knowledge Extent of knowledge Synergy and put OM into practice
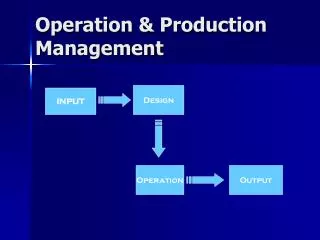
OM all around us OM is the management of all processes used to design, supply, produce, and deliver valuable goods and services to customers IN Out Processing-transformation TQM = Total Quality Management ERP:Logistics, Transportation , MRP, JIT, APS, Lean Manufacturing, Little´s law ERP: Marketing, Selling, Invoicing, Payment,….
Selected OM methods, which will be kicked around as time will move on • Theory of Constraints-(AOMA-AOPR) • Balanced Scorecard -(AOMA-AOPR) • Project Management methods (Critical Chain) -(AOMA-AOPR) • Material Requirement Planning (MRP) and Just-in-Timeprinciples -(AOMA onlybasics-AOPR more in detail) • Advanced Planning and Scheduling (APS)(AOPR onlybasics) • Six Sigma – quality management -(AOMA-AOPR) • Boston, SWOT and Magic Quadrant Matrices-(AOMA-AOPR) • Little´s Law (relations between WIP, Throughput and Cycle time)-(AOPR) • Linear programming – optimisation -(AOPR) • Yield Management -(AOPR) • Kepner-Tregoe(support of decision making) -(AOMA-AOPR) • Decision trees-(AOPR)
Some tools which have to be used • ERP-Enterprise Resource Planning (MS Dynamics NAV) • Basic installation, handling and setup • Inventory – Items – Transports –Availability of components • Purchase –dealing with Suppliers (SCM) • Selling – dealing with Customers • Payment – bank operations • Accounting basics • CRM- Customer Relationship Management • Manufacturing – Planning and Shop Floor Control • Cost management Serves as the magnifying glass to processes…
Controlling processes in Supply Chain Management (SCM) Demand Planning Strategic Planning levels Tactical Operational Operational Used abbreviations : R&D –Research and Development; TQM-Total Quality Management; JIT- Just –In-Time; MRP_II-Manufacturing and Resource Planning Used abbreviations (slide number 3 ): : ERP - Enterprise Resource Planning ; APS – Advanced Planning and Scheduling ,MRP-Material Requirement Planning
Deming cycle (based on periodicity) Plan:Define the problem to be addressed, collect relevant data, and ascertain the problem's root cause (e.g. by use of TOC=Theory of Constraint) Do: Develop and implement a solution; decide upon a measurement to gauge (assess) its effectiveness. Check: Confirm the results through before-and-after data comparison. Act: Document the results, inform others about process changes, and make recommendations for the problem to be addressed in the next PDCA cycle. Used abbreviations : TOC – Theory of Constraints
Another angle of view This will be modified in following South African project show (use of Balanced Score Card) Theoryofconstraints Project management Linearprogramming Production Business Intelligence Totalquality management Productpostitioning Criticalchain Workflow Drum –Buffer-Rope Decision Making -trees Pareto, ishikawa Boston Matrix Gartner QM Cutting, blending MRP-MRP-II,JIT,APS ProductLifeCycle Kepner-Tregoe CONWIP Logistics Pareto, Ishikawa SCRUM Yield management Hurwitz EOQ Six Sigma ProspectTheory ABC LEAN Function block Logistic more in detail will be presented later in this show Little´slaw Used abbreviations : QM– Quadrant Matrix; CONWIP – Constant Work in Progress; EOQ – Economic Order Quantity ; MRP - Material Requirement Planning
Another angle of view Product Money Demand Financial needs
Operations See next slide Bill of material
Function block Logistic-simplified Inventory Management Warehouse Management Orders (dependentdemand) InventoryCosting Forecasts (independent demand) Transportation Will be part of our course regarding ERP system MS Dynamics NAV
Procedures-simplified Color agenda used later Input Transformation Output Resource (modified) : dowtsx
Processing (not organised set of processes, will be presented also as a introduction to project management PWP presentation later) Purchase Order Reporting Load-despatch Statistics Consumption registration Production Output registration Output check (Quality control) Inventory value calculation Delivery Production Planning Sales Order Component replenishment Process flow ? Transfer to Production Input check Put-away Cross-docking Invoicing Finished goods to Inventory Picking from Inventory Payment Resource : Skorkovský
Your main task (to organize processes based on business logic) Production Planning Input check Purchase Order Component replenishment Sales Order(demand) Picking from Inventory Put-away Inventory value calculation Transfer to Production Consumption registration Production Output registration Finished goods to Inventory Load-despatch Inventory value calculation Cross-docking Payment to Vendor Inventory value calculation Invoicing Output check Shipment Payment from Customer Statistics Reporting Agenda Transformation Output Input Control Logistics Resource : Skorkovský
Your main task (possible problems, bottlenecks, undesirable effects..) Production Planning Input check Purchase Order Component replenishment Sales Order Picking from Inventory Put-away Inventory value calculation Transfer to Production Consumption registration Cross-docking Production Output registration Finished goods to Inventory Load-despatch Inventory value calculation Priorities ? Payment to Vendor Inventory value calculation Invoicing Output check Shipment Payment from Customer Statistics Reporting Application of TOC ->thinking tools->Current Reality Tree – first stage Resource : Skorkovský
Your main task (Search - HOW ??? Measure impacts –HOW ??? and Destroy – HOW ???) Cause-Effect relation Cause-Effect relation Cause-Effect relations Cause-Effect relation Cause-Effect relation Root Problem (e.g.low profit )
Basic problem I. (one of many) We have a huge data quantity Moore's law is the observation that the number of transistors in a dense integrated circuits doubles approximately every two years – so -> capacity of memory is going up
Big data and analysis problem • In test and measurement applications, engineers and scientists can collect vast amounts of data every second of every day. • For every second that the Large Hadron Collider at CERN runs an experiment, the instrument can generate 40 terabytes of data. • For every 30 minutes that a Boeing jet engine runs, the system creates 10 terabytes of operations information. • For a single journey across the Atlantic Ocean, a four-engine jumbo jet can create 640 terabytes of data. • Multiply that by the more than 25,000 flights flown each day, and you get an understanding of the enormous amount of data that exists (Rogers, 2011). That’s “Big Data.” CERN = Conseil Européen pour la Recherche Nucléaire –Resource: https://home.cern/about HardonCollider-accelerator
Basic problem II. (we need reliable data ) To solve it we should use finite capacity scheduling (APS)- will be presented later T1+T2=X Opt=Min(X) Op1 T2 T2 = 0 Op1 Op2 Op2 Op3 T1 = 0 Op3 T1
Basic problem III. Will be explained in Little´s law presentation (AOPR) : WIP= WorkIn Progress
Basic problem IV. Black White Black White (Black ->White, Setuptime=60 minut) (White->Black, Setuptime = 20 minut)
Basic problem V-I.(availability of components) A0 Op1 20 pcs of A7 and 20 pcs of A8 A1 A2 Op2 10 pcs of A4 and 10 pcs of A5 (will be delivered in T1+X time ) A3 T0 Op3 Lead time to produce A6 A4 A5 Lead time to produce A3 T1 T2 A6 A7 A8 Op1 X= slack = delay Bill Of Material=BOM (tree structure) Op2 T1 Op3 T1+X For sake of simplicity we did not mentioned components A1 and A2 and possible delays having cause in delivery times of bad quality !!! Same with capacities of machines allocated to OP1-OP2-OP3 ( sudden breakdowns)
Basic problem V-II. (availability of components ) Gannt chart APS result ->18.8.->23.8. a 27.8.->10.9