
East Fork Whitewater River Water Quality Duration Curve Site: GMW070-0021
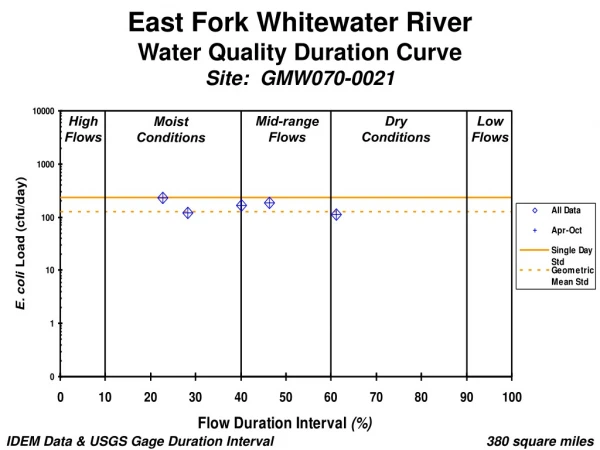
East Fork Whitewater River Water Quality Duration Curve Site: GMW070-0021. High Flows. Mid-range Flows. Dry Conditions. Low Flows. Moist Conditions. IDEM Data & USGS Gage Duration Interval. 380 square miles.

East Fork Whitewater River Water Quality Duration Curve Site: GMW070-0021
E N D
Presentation Transcript
East Fork Whitewater RiverWater Quality Duration Curve Site: GMW070-0021 High Flows Mid-range Flows Dry Conditions Low Flows Moist Conditions IDEM Data & USGS Gage Duration Interval 380 square miles
East Fork Whitewater RiverWater Quality Duration Curve Site: GMW070-0063 High Flows Mid-range Flows Dry Conditions Low Flows Moist Conditions IDEM Data & USGS Gage Duration Interval 380 square miles
East Fork Whitewater RiverWater Quality Duration Curve Site: GMW070-0015 High Flows Mid-range Flows Dry Conditions Low Flows Moist Conditions IDEM Data & USGS Gage Duration Interval 380 square miles
East Fork Whitewater RiverWater Quality Duration Curve Site: GMW070-0053 High Flows Mid-range Flows Dry Conditions Low Flows Moist Conditions IDEM Data & USGS Gage Duration Interval 380 square miles


