Download
1 / 7
70 likes | 180 Vues
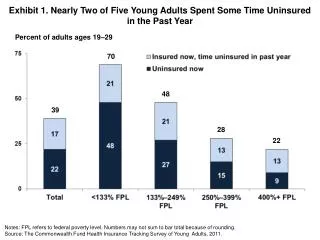
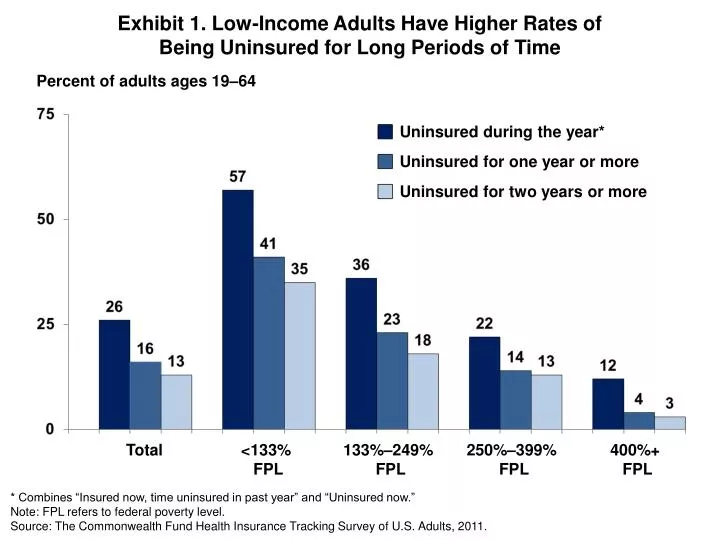
Exhibit 1. Low-Income Adults Have Higher Rates of Being Uninsured for Long Periods of Time. Percent of adults ages 19–64. Uninsured during the year*. Uninsured for one year or more. Uninsured for two years or more. Total. <133% FPL. 133%–249% FPL. 250%–399% FPL. 400%+ FPL.

E N D
Exhibit 1. Low-Income Adults Have Higher Rates of Being Uninsured for Long Periods of Time Percent of adults ages 19–64 Uninsured during the year* Uninsured for one year or more Uninsured for two years or more Total <133% FPL 133%–249% FPL 250%–399% FPL 400%+ FPL * Combines “Insured now, time uninsured in past year” and “Uninsured now.” Note: FPL refers to federal poverty level. Source: The Commonwealth Fund Health Insurance Tracking Survey of U.S. Adults, 2011.
Exhibit 2. Factors in Decision to Visit an Emergency Room, Adults with Low and Moderate Incomes Percent of adults ages 19–64 who used ER in past year,* income less than 250% FPL * Respondent used ER at least once in past 12 months to get care for themselves or family member in evenings or on weekends. ** Combines “Insured now, time uninsured in past year” and “Uninsured now.” Note: FPL refers to federal poverty level. Source: The Commonwealth Fund Health Insurance Tracking Survey of U.S. Adults, 2011.
Exhibit 3. Uninsured Adults with Low and Moderate Incomes Are Less Likely to Be Up to Date with Recommended Preventive Tests Percent of adults ages 19–64, income less than 250% FPL Notes: FPL refers to federal poverty level. Preventive tests: blood pressure checked in past year; cholesterol checked in past five years (in past year if has hypertension or heart disease); Pap test in past year for females ages 19–29, in past three years for ages 30–64; mammogram in past two years for females ages 40–64; and colon cancer screening in past five years for adults ages 50–64. * Combines “Insured now, time uninsured in past year” and “Uninsured now.” Source: The Commonwealth Fund Health Insurance Tracking Survey of U.S. Adults, 2011.
Exhibit 4. Reasons for Skipping Cancer Screening Tests Percent of adults ages 19–64 who skipped recommended preventive care * Did not have Pap test in past year for females ages 19–29, in past three years for ages 30–64. ** Did not have colon cancer screening in past five years for adults ages 50–64. *** Did not have mammogram in past two years for females ages 40–64. ^ Sample size too small to report mammogram results for “uninsured during the year.” Source: The Commonwealth Fund Health Insurance Tracking Survey of U.S. Adults, 2011.
Exhibit 5. Medicaid Is an Important Source of Coverage for Families and Children with Low and Moderate Incomes Percent of adults ages 19–64 63 32 21 9 Notes: FPL refers to federal poverty level. * Had Medicaid in past two years, but does not currently receive Medicaid and does not have children who receive Medicaid/CHIP. Source: The Commonwealth Fund Health Insurance Tracking Survey of U.S. Adults, 2011.
Exhibit 6. Medicaid Is Particularly Important for Low- and Moderate-Income Families with Children Percent of adults ages 19–64 with children* * Children under age 26. Note: FPL refers to federal poverty level. Source: The Commonwealth Fund Health Insurance Tracking Survey of U.S. Adults, 2011.
Exhibit 7. Premium Tax Credits and Cost-Sharing ProtectionsUnder the Affordable Care Act Catastrophic policy with essential benefits package available to young adults and people whose premiums are 8%+ of income Notes: Actuarial values are the average percent of medical costs covered by a health plan. Premium and cost-sharing credits are for the silver plan. Source: Federal poverty levels are for 2011; Commonwealth Fund Health Reform Resource Center: What’s in the Affordable Care Act? (PL 111-148 and 111-152), http://www.commonwealthfund.org/Health-Reform/Health-Reform-Resource.aspx.