Download
1 / 17
170 likes | 328 Vues
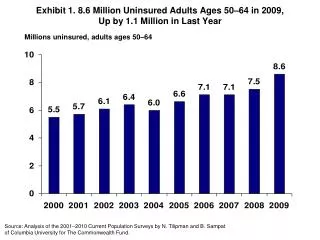
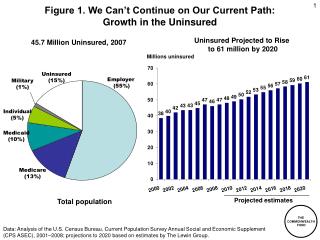
Figure ES-1. Uninsured Rates High Among Adults with Low and Moderate Incomes, 2001–2005. Percent of adults ages 19–64. 53. 52. 49. 41. 35. 28. 28. 26. 24. 18. 16. 13. 7. 4. 4. 2001. 2003. 2005. 2001. 2003. 2005. 2001. 2003. 2005. 2001. 2003. 2005. 2001. 2003. 2005.

E N D
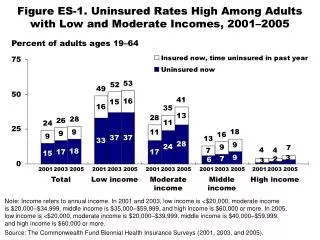
Figure ES-1. Uninsured Rates High Among Adultswith Low and Moderate Incomes, 2001–2005 Percent of adults ages 19–64 53 52 49 41 35 28 28 26 24 18 16 13 7 4 4 2001 2003 2005 2001 2003 2005 2001 2003 2005 2001 2003 2005 2001 2003 2005 Total Low income Moderate income Middle income High income Note: Income refers to annual income. In 2001 and 2003, low income is <$20,000, moderate incomeis $20,000–$34,999, middle income is $35,000–$59,999, and high income is $60,000 or more. In 2005,low income is <$20,000, moderate income is $20,000–$39,999, middle income is $40,000–$59,999,and high income is $60,000 or more. Source: The Commonwealth Fund Biennial Health Insurance Surveys (2001, 2003, and 2005).
Figure ES-2. Adults Without Insurance AreLess Likely to Be Able to Manage Chronic Conditions Percent of adults ages 19–64 with at least one chronic condition* * Hypertension, high blood pressure, or stroke; heart attack or heart disease; diabetes; asthma, emphysema, or lung disease. Source: The Commonwealth Fund Biennial Health Insurance Survey (2005).
Figure 1. Uninsured Rates High Among Adultswith Low and Moderate Incomes, 2001–2005 Percent of adults ages 19–64 53 52 49 41 35 28 28 26 24 18 16 13 7 4 4 2001 2003 2005 2001 2003 2005 2001 2003 2005 2001 2003 2005 2001 2003 2005 Total Low income Moderate income Middle income High income Note: Income refers to annual income. In 2001 and 2003, low income is <$20,000, moderate incomeis $20,000–$34,999, middle income is $35,000–$59,999, and high income is $60,000 or more. In 2005,low income is <$20,000, moderate income is $20,000–$39,999, middle income is $40,000–$59,999,and high income is $60,000 or more. Source: The Commonwealth Fund Biennial Health Insurance Surveys (2001, 2003, and 2005).
Figure 2. The Majority of Uninsured AdultsAre in Working Families Adults ages 19–64 with any time uninsured Adult work status Family work status No worker in family 21% At leastonefull-time worker 67% Not currently employed 36% Full-time 49% Onlypart-time worker(s) 11% Part-time 15% Note: Percentages may not sum to 100% because of rounding. Source: The Commonwealth Fund Biennial Health Insurance Survey (2005).
Figure 3. More than Three of Five Working Adultswith Any Time Uninsured Are Employed inFirms with Less than 100 Employees Percent of employed adults with any time uninsured, ages 19–64 Don’t know/refused 4% Self-employed/1 employee 10% 500+ employees 21% 2–19 employees 31% 100–499 employees 11% 20–99 employees 22% Note: Percentages may not sum to 100% because of rounding. Source: The Commonwealth Fund Biennial Health Insurance Survey (2005).
Figure 4. Length of Time Uninsured,Adults Ages 19–64 Insured now,time uninsured in past year 16.2 million Uninsured at thetime of the survey 31.6 million Don’t know/refused 1% Don’t know/refused 2% 3 months or less 6% 4 to 11 months 11% One year or more 26% 3 months or less 34% One year or more 82% 4 to 11 months 39% Note: Percentages may not sum to 100% because of rounding. Source: The Commonwealth Fund Biennial Health Insurance Survey (2005).
Figure 5. Many Americans Have ProblemsPaying Medical Bills or Are Paying Off Medical Debt Percent of adults ages 19–64 who had the following problemsin past year: * Includes only those individuals who had a bill sent to a collection agency when they were unable to pay it. Source: The Commonwealth Fund Biennial Health Insurance Survey (2005).
Figure 6. One-Quarter of Adults withMedical Bill Burdens and Debt Were Unableto Pay for Basic Necessities Percent of adults ages 19–64 with medical bill problemsor accrued medical debt: Source: The Commonwealth Fund Biennial Health Insurance Survey (2005).
Figure 7. Cost-Related Access ProblemsRemain High Percent of adults ages 19–64 who had any of four access problems* in past year because of cost * Did not fill a prescription; did not see a specialist when needed; skipped recommended medical test, treatment, or follow-up; had a medical problem but did not visit doctor or clinic. Source: The Commonwealth Fund Biennial Health Insurance Surveys (2001, 2003, and 2005).
Figure 8. Lacking Health Insurance for Any PeriodThreatens Access to Care Percent of adults ages 19–64 reporting the following problemsin past year because of cost: Source: The Commonwealth Fund Biennial Health Insurance Survey (2005).
Figure 9. Adults Without Insurance Are Less Likelyto Be Able to Manage Chronic Conditions Percent of adults ages 19–64 with at least one chronic condition* * Hypertension, high blood pressure, or stroke; heart attack or heart disease; diabetes; asthma, emphysema, or lung disease. Source: The Commonwealth Fund Biennial Health Insurance Survey (2005).
Figure 10. Adults Without Insurance AreLess Likely to Get Preventive Screening Tests Percent of adults Note: Pap test in past year for females ages 19–29, past three years age 30+; colon cancer screening in past five years for adults age 50–64; and mammogram in past two years for females age 50–64. Source: The Commonwealth Fund Biennial Health Insurance Survey (2005).
Figure 11. Adults Without InsuranceAre Less Likely to Have a Regular Doctoror Rate Their Quality of Care Highly Percent of adults ages 19–64 Source: The Commonwealth Fund Biennial Health Insurance Survey (2005).
Figure 12. Adults Without Insurance HaveMore Problems with Lab Tests and Records Percent of adults ages 19–64 reporting the following problemsin past two years: Source: The Commonwealth Fund Biennial Health Insurance Survey (2005).
Figure 13. Lacking Health Insurance for Any PeriodThreatens Patient–Provider Communication Percent of adults ages 19–64 reporting the following problemsin past two years: Source: The Commonwealth Fund Biennial Health Insurance Survey (2005).
Figure 14. Many Americans Express a Lack of Confidence in Ability to Get High-Quality Care Percent of adults ages 19–64 who are not too/not at all confident Source: The Commonwealth Fund Biennial Health Insurance Survey (2005).
Figure 15. Only Two of Five Americans AreVery Satisfied with the Quality of Health Care Percent of adults ages 19–64 who are very satisfied Source: The Commonwealth Fund Biennial Health Insurance Survey (2005).