Download
1 / 22
220 likes | 371 Vues
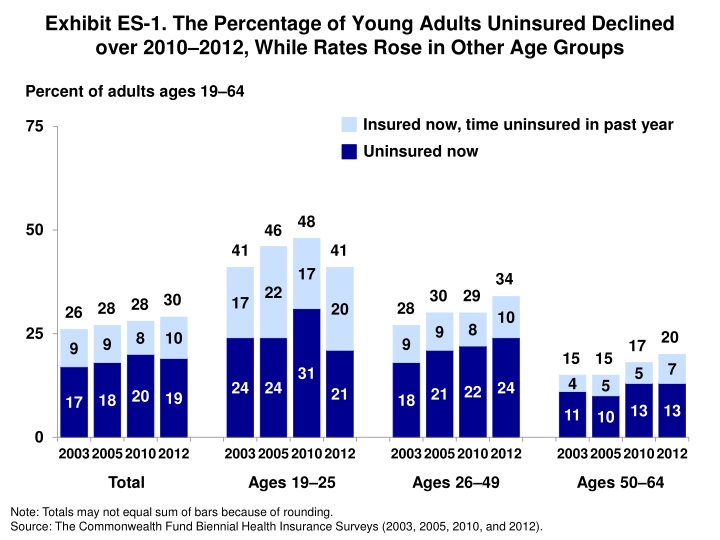
Exhibit ES-1. The Percentage of Young Adults Uninsured Declined over 2010–2012, While Rates Rose in Other Age Groups. Percent of adults ages 19–64. Insured now, time uninsured in past year. Uninsured now. 48. 46. 41. 41. 34. 30. 29. 30. 28. 28. 28. 26. 20. 17. 15. 15. Total.

E N D
Exhibit ES-1. The Percentage of Young Adults Uninsured Declined over 2010–2012, While Rates Rose in Other Age Groups Percent of adults ages 19–64 Insured now, time uninsured in past year Uninsured now 48 46 41 41 34 30 29 30 28 28 28 26 20 17 15 15 Total Ages 19–25 Ages 26–49 Ages 50–64 Note: Totals may not equal sum of bars because of rounding. Source: The Commonwealth Fund Biennial Health Insurance Surveys (2003, 2005, 2010, and 2012).
Exhibit ES-2. In 2012, Nearly Half of Adults Were Uninsured During the Year or Were Underinsured Uninsured during the year* 30% 55 million Insured all year, not underinsured^ 54% 100 million Insured all year, underinsured^ 16% 30 million 184 million adults ages 19–64 Note: Numbers may not sum to indicated total because of rounding. * Combines “Uninsured now” and “Insured now, time uninsured in past year.” ^ Underinsured defined as insured all year but experienced one of the following: out-of-pocket expenses equaled 10% or more of income; out-of-pocket expenses equaled 5% or more of income if low income (<200% of poverty); or deductibles equaled 5% or more of income. Source: The Commonwealth Fund Biennial Health Insurance Survey (2012).
Exhibit ES-3. No Improvement in Coverage for Adults Overall from 2010 to 2012 * Combines “Uninsured now” and “Insured now, time uninsured in past year.” ^ Underinsured defined as insured all year but experienced one of the following: out-of-pocket expenses equaled 10% or more of income; out-of-pocket expenses equaled 5% or more of income if low income (<200% of poverty); or deductibles equaled 5% or more of income. ** Includes: had problems paying or unable to pay medical bills; contacted by collection agency for unpaid medical bills; had to change way of life to pay bills; medical bills being paid off over time. *** Includes any of the following because of cost: had a medical problem, did not visit doctor or clinic; did not fill a prescription; skipped recommended test, treatment, or follow-up; did not get needed specialist care. ^^ A comparable bill problems question series was not asked in 2003. Source: The Commonwealth Fund Biennial Health Insurance Surveys (2003, 2005, 2010, and 2012).
Exhibit ES-4. Adults with Low Incomes Are Uninsured and Underinsured at the Highest Rates, 2012 Percent of adults ages 19–64 Insured all year, underinsured^ Insured now, time uninsured in past year Uninsured now 75 59 46 35 Unin-sured during the year* 30% 52% 17 37% 19% 7% <$30,657 $57,625 $92,200 $92,200+ Notes: Totals may not equal sum of bars because of rounding. FPL refers to federal poverty level. Income levels are for a family of four in 2012. ^ Underinsured defined as insured all year but experienced one of the following: out-of-pocket expenses equaled 10% or more of income; out-of-pocket expenses equaled 5% or more of income if low income (<200% of poverty); or deductibles equaled 5% or more of income. * Combines “Uninsured now” and “Insured now, time uninsured in past year.” Source: The Commonwealth Fund Biennial Health Insurance Survey (2012).
Exhibit ES-5. Under Full Implementation, the Affordable Care Act Has the Potential to Provide New Coverage and Protections to Working-Age Adults Notes: FPL refers to federal poverty level. Total column includes those with undesignated income. Income levels are for a family of four in 2012. * Combines “Uninsured now” and “Insured now, time uninsured in past year.” ^ Underinsured defined as insured all year but experienced one of the following: out-of-pocket expenses equaled 10% or more of income; out-of-pocket expenses equaled 5% or more of income if low income (<200% of poverty); or deductibles equaled 5% or more of income. ** Includes: had problems paying or unable to pay medical bills; contacted by collection agency for unpaid medical bills; had to change way of life to pay bills; medical bills being paid off over time. *** Includes any of the following because of cost: had a medical problem, did not visit doctor or clinic; did not fill a prescription; skipped recommended test, treatment, or follow-up; did not get needed specialist care. **** Base: Respondents who specified income level and premium for private insurance plan. Source: The Commonwealth Fund Biennial Health Insurance Survey (2012).
Exhibit 1. The Percentage of Young Adults Uninsured Declined over 2010–2012, While Rates Rose in Other Age Groups Percent of adults ages 19–64 Insured now, time uninsured in past year Uninsured now 48 46 41 41 34 30 29 30 28 28 28 26 20 17 15 15 Total Ages 19–25 Ages 26–49 Ages 50–64 Note: Totals may not equal sum of bars because of rounding. Source: The Commonwealth Fund Biennial Health Insurance Surveys (2003, 2005, 2010, and 2012).
Exhibit 2. In 2012, Nearly Half of Adults Were Uninsured During the Year or Were Underinsured Uninsured during the year* 30% 55 million Insured all year, not underinsured^ 54% 100 million Insured all year, underinsured^ 16% 30 million 184 million adults ages 19–64 Note: Numbers may not sum to indicated total because of rounding. * Combines “Insured now, time uninsured in past year” and “Uninsured now.” ^ Underinsured defined as insured all year but experienced one of the following: out-of-pocket expenses equaled 10% or more of income; out-of-pocket expenses equaled 5% or more of income if low income (<200% of poverty); or deductibles equaled 5% or more of income. Source: The Commonwealth Fund Biennial Health Insurance Survey (2012).
Exhibit 3. No Improvement in Coverage for Adults Overall from 2010 to 2012 * Combines “Uninsured now” and “Insured now, time uninsured in past year.” ^ Underinsured defined as insured all year but experienced one of the following: out-of-pocket expenses equaled 10% or more of income; out-of-pocket expenses equaled 5% or more of income if low income (<200% of poverty); or deductibles equaled 5% or more of income. Note: Sum of “Uninsured during the year” and “Underinsured” may not sum to noted totals because of rounding. Source: The Commonwealth Fund Biennial Health Insurance Surveys (2003, 2005, 2010, and 2012).
Exhibit 4. Since 2003, the Proportion of Adults with High Deductibles Has More Than Tripled Percent of insured adults ages 19–64* 2003 2005 2010 2012 * Base: Those who reported information about a deductible. Source: The Commonwealth Fund Biennial Health Insurance Surveys (2003, 2005, 2010, and 2012).
Exhibit 5. Adults with Low Incomes Are Uninsured and Underinsured at the Highest Rates, 2012 Percent of adults ages 19–64 Insured all year, underinsured^ Insured now, time uninsured in past year Uninsured now 75 59 46 35 Unin-sured during the year* 30% 52% 17 37% 19% 7% <$30,657 $57,625 $92,200 $92,200+ Notes: Totals may not equal sum of bars because of rounding. FPL refers to federal poverty level. Income levels are for a family of four in 2012. ^ Underinsured defined as insured all year but experienced one of the following: out-of-pocket expenses equaled 10% or more of income; out-of-pocket expenses equaled 5% or more of income if low income (<200% of poverty); or deductibles equaled 5% or more of income. * Combines “Uninsured now” and “Insured now, time uninsured in past year.” Source: The Commonwealth Fund Biennial Health Insurance Survey (2012).
Exhibit 6. One of Three Adults in the Individual Insurance Market Spent 10 Percent or More of Income on Premiums in 2012 Percent of adults ages 19–64 with private health insurance who spent 10% or more of income on premiums* <$30,657 $57,625 $92,200 $92,200+ * Base: Respondents who reported their income level and premium costs for their private insurance plan. Notes: Income levels are for a family of four in 2012. FPL refers to federal poverty level. Source: The Commonwealth Fund Biennial Health Insurance Survey (2012).
Exhibit 7. Millions of Adults Continue to Report Problems Paying Medical Bills or Medical Debt * Subtotals may not sum to total: respondents who answered “don’t know” or refused are included in the distribution but not reported. Source: The Commonwealth Fund Biennial Health Insurance Surveys (2005, 2010, and 2012).
Exhibit 8. Problems with Medical Bills or Accrued Medical Debt Highest Among Adults with Low and Moderate Incomes, 2012 Percent of adults ages 19–64 with medical bill problems or accrued medical debt** <$30,657 $57,625 $92,200 $92,200+ Notes: FPL refers to federal poverty level. Income levels are for a family of four in 2012. ** Had problems paying medical bills, contacted by a collection agency for unpaid bills, had to change way of life in order to pay medical bills, or has outstanding medical debt. ^ Underinsured defined as insured all year but experienced one of the following: out-of-pocket expenses equaled 10% or more of income; out-of-pocket expenses equaled 5% or more of income if low income (<200% of poverty); or deductibles equaled 5% or more of income. * Combines “Uninsured now” and “Insured now, time uninsured in past year.” Source: The Commonwealth Fund Biennial Health Insurance Survey (2012).
Exhibit 9. Adults with Low Incomes Less Likely to Be Able to Pay for Basic Necessities Because of Medical Bill or Debt Problems Percent of adults ages 19–64 with medical bill problems or accrued medical debt* * Base: Had problems paying medical bills, contacted by a collection agency for unpaid bills, had to change way of life in order to pay medical bills, or has outstanding medical debt. Notes: FPL refers to federal poverty level. Income levels are for a family of four in 2012. Source: The Commonwealth Fund Biennial Health Insurance Survey (2012).
Exhibit 10. Number of Adults Reporting Cost-Related Problems Getting Needed Care Increased, 2003–2012 Source: The Commonwealth Fund Biennial Health Insurance Surveys (2003, 2005, 2010, and 2012).
Exhibit 11. Cost-Related Problems Getting Needed Care Are Highest Among Adults with Low and Moderate Incomes, 2012 Percent of adults ages 19–64 who had any of four access problems** in past year because of cost <$30,657 $57,625 $92,200 $92,200+ Notes: FPL refers to federal poverty level. Income levels are for a family of four in 2012. ** Did not fill a prescription; did not see a specialist when needed; skipped recommended medical test, treatment, or follow-up; had a medical problem but did not visit doctor or clinic. ^ Underinsured defined as insured all year but experienced one of the following: out-of-pocket expenses equaled 10% or more of income; out-of-pocket expenses equaled 5% or more of income if low income (<200% of poverty); or deductibles equaled 5% or more of income. * Combines “Uninsured now” and “Insured now, time uninsured in past year.” Source: The Commonwealth Fund Biennial Health Insurance Survey (2012).
Exhibit 12. Adults Uninsured During the Year or Underinsured Are More Likely to Skip Doses or Not Fill Prescriptions for Chronic Conditions, 2012 Percent of adults ages 19–64 with at least one chronic condition* who skipped doses or did not fill prescription for chronic condition because of cost * Adults with hypertension or high blood pressure; diabetes; asthma, emphysema, or lung disease; or heart disease, who take prescription medications on a regular basis. ^ Underinsured defined as insured all year but experienced one of the following: out-of-pocket expenses equaled 10% or more of income; out-of-pocket expenses equaled 5% or more of income if low income (<200% of poverty); or deductibles equaled 5% or more of income. Source: The Commonwealth Fund Biennial Health Insurance Survey (2012).
Exhibit 13. Uninsured Adults Are Less Likely to Have a Regular Source of Care, 2012 Percent of adults ages 19–64 ^ Underinsured defined as insured all year but experienced one of the following: out-of-pocket expenses equaled 10% or more of income; out-of-pocket expenses equaled 5% or more of income if low income (<200% of poverty); or deductibles equaled 5% or more of income. Notes: Seasonal flu shot in past 12 months; cholesterol checked in past five years (in past year if has hypertension, heart disease, or high cholesterol); blood pressure checked in past two years (in past year if has hypertension or high blood pressure). Source: The Commonwealth Fund Biennial Health Insurance Survey (2012).
Exhibit 14. Uninsured Adults and Adults with Gaps in Coverage Have Lower Rates of Cancer Screening Tests, 2012 Percent of adults ^ Underinsured defined as insured all year but experienced one of the following: out-of-pocket expenses equaled 10% or more of income; out-of-pocket expenses equaled 5% or more of income if low income (<200% of poverty); or deductibles equaled 5% or more of income. * Combines “Uninsured now” and “Insured now, time uninsured in past year.” Notes: Pap test in past three years for females ages 21–64; colon cancer screening in past five years for adults ages 50–64; and mammogram in past two years for females ages 40–64. Source: The Commonwealth Fund Biennial Health Insurance Survey (2012).
Exhibit 15. Premium Tax Credits and Cost-Sharing ProtectionsUnder the Affordable Care Act Catastrophic policy with essential benefits package available to young adults and people whose premiums are 8%+ of income Notes: Actuarial values are the average percent of medical costs covered by a health plan. Premium and cost-sharing credits are for silver plan. * Combines “Uninsured now” and “Insured now, time uninsured in past year.” ^Underinsured defined as insured all year but experienced one of the following: out-of-pocket expenses equaled 10% or more of income; out-of-pocket expenses equaled 5% or more of income if low income (<200% of poverty); or deductibles equaled 5% or more of income. ^^ For 2013. Source: Federal poverty levels are for 2012; Commonwealth Fund Health Reform Resource Center: What’s in the Affordable Care Act? (PL 111-148 and 111-152), http://www.commonwealthfund.org/Health-Reform/Health-Reform-Resource.aspx.
Exhibit 16. Under Full Implementation, the Affordable Care Act Has the Potential to Provide New Coverage and Protections to Working-Age Adults Notes: FPL refers to federal poverty level. Total column includes those with undesignated income. Income levels are for a family of four in 2012. * Combines “Uninsured now” and “Insured now, time uninsured in past year.” ^ Underinsured defined as insured all year but experienced one of the following: out-of-pocket expenses equaled 10% or more of income; out-of-pocket expenses equaled 5% or more of income if low income (<200% of poverty); or deductibles equaled 5% or more of income. ** Includes: had problems paying or unable to pay medical bills; contacted by collection agency for unpaid medical bills; had to change way of life to pay bills; medical bills being paid off over time. *** Includes any of the following because of cost: had a medical problem, did not visit doctor or clinic; did not fill a prescription; skipped recommended test, treatment, or follow-up; did not get needed specialist care. **** Base: Respondents who specified income level and premium for private insurance plan. Source: The Commonwealth Fund Biennial Health Insurance Survey (2012).
Exhibit 17. Annual Premium Amount and Tax Credits for a Family of Four Under the Affordable Care Act, 2014 Annual premium amount paid by policy holder and premium tax credit Premium tax credit Required premium payment by policy holder Full premium = $12,130 Contri-butioncapped at 9.5% of income Contri-butioncapped at 8.05% of income Contri-butioncapped at 6.3% of income Contri-butioncapped at 4.0% of income Contri-butioncapped at 3.3% of income $32,326 $35,137 $46,850 $58,562 $70,275 $117,125 Notes: For an family of four, policy holder age 40, in a medium-cost area in 2014. Premium estimates are based on an actuarial value of 0.70. Actuarial value is the average percent of medical costs covered by a health plan. FPL refers to federal poverty level. Source: Premium estimates are from Kaiser Family Foundation Health Reform Subsidy Calculator, http://healthreform.kff.org/Subsidycalculator.aspx.