Development of NMR-Based Metabolomics Analysis Methodology for Toxicology
This methodology aligns, reduces noise, and statistically identifies significant metabolic signals for toxicity analysis using NMR spectrometry. It includes noise elimination, spectral region scanning with Bayesian risk cost for signal presence, and quantification of effects for biomarker identification. A case study on mice dosed with TCDD shows successful reduction of active bins and significant results. This method can be applied for exposure and toxicity studies.

Development of NMR-Based Metabolomics Analysis Methodology for Toxicology
E N D
Presentation Transcript
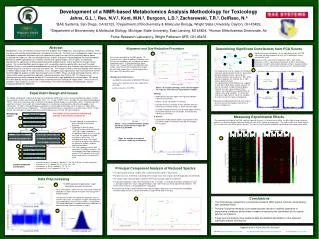
acquire spectra remove extrinsic peaks region 68 region 69 normalize to total intensity C8(168hr) establish noise baseline C(168hr) (correlation reference) 3 max c = 0.9202 yes no 1 C(168hr) bin? T(168hr) C(72hr) C11(72hr) PC 2 lag = 0.080 PPM choose bin size subdivide spectrum into regions lag = 0.080 PPM 2 Singular value normalized amplitude (arb.) cross correlation value 4 PC 2 T(72hr) integrate intensities in each bin align all samples in each region T1(168hr) T(168hr) lag = 0 PPM PC 1 C(72hr) lag = 0.002 PPM concatenate -> reduced spectrum T(72hr) T17(72hr) do PCA, cluster conditions lag = 0.069 PPM Singular value index lag = 0.069 PPM lag (PPM) PCA scores->significant data PC 1 chemical shift (PPM) nonparametric significance test determine fold, abs. change extremes: p-value = 0.016 1 1 2 2 3 3 4 4 C168 C168 C168 C168 T168 T168 T168 T168 C72 C72 T72 T72 C72 C72 T72 T72 Development of a NMR-based Metabolomics Analysis Methodology for Toxicology Jahns, G.L.1, Reo, N.V.2, Kent, M.N.2, Burgoon, L.D.3, Zacharewski, T.R.3, DelRaso, N.4 1BAE Systems, San Diego, CA 92123, 2Department of Biochemistry & Molecular Biology, Wright State University, Dayton, OH 45429, 3Department of Biochemistry & Molecular Biology, Michigan State University, East Lansing, MI 48824, 4Human Effectiveness Directorate, Air Force Research Laboratory, Wright Patterson AFB, OH 45433 Abstract Alignment and Size Reduction Procedure Determining Significant Contributors from PCA Scores Metabolomics is the simultaneous measurement of metabolites from endogenous and exogenous chemicals, which may be used to identify putative biomarkers of exposure and toxicity. Currently, most metabolomics studies focus on using pattern recognition techniques to cluster spectrometric peaks, but most fail to statistically identify peaks associated with exposure. We have developed a data analysis and processing methodology for Nuclear Magnetic Resonance (NMR) spectrometry to 1) identify and eliminate spectral regions with no signal, 2) statistically characterize the significance of differentially expressed metabolite signals, and 3) quantify the change in these signals. The method identifies spectral regions with no signal by scanning spectra with a low-level threshold. Detection Theory is used to produce probabilistic estimates of the presence of a treatment effect, based on either a minimum Bayesian risk cost or a constant false alarm rate. The treatment effect is then quantified by either absolute or relative (fold) changes of the significant bins. As an example, hepatic lipid extracts from mice dosed with 2,3,7,8-tetrachlorodibenzo-p-dioxin (TCDD) were analyzed using 13C NMR. Noise screening eliminated channels with no signal in both control and treatment replicates, reducing active bins from 1024 to 192. The Bayesian-cost significance metric further reduced the data to 77 channels with a high probability of treatment effect. We ranked these bins both by absolute and by fold change to identify channels showing the largest effect. These results are valuable as they stand, or can serve as a screened basis for further classification and identification analysis. Funded by NIEHS RO1 ES013927 3 Significant spectral contributions to the separation found in the PCA scores plot are determined pairwise for the 4 combinations shown schematically at left: 7 As has been described for 1H NMR spectra, 13C resonances are subject to additional frequency shifts that can cause problems with misalignment of peaks (“positional noise”). In lipid samples from tissue extracts, the 13C peak positions are dependent upon sample concentration and the composition of lipids present.Lipid composition is a true biological effect that is part of the positional noise. Controls at 72 hr. referenced to Controls at 168 hr. (time effect) Treatments at 72 hr. referenced to Treatments at 168 hr. (time effect) Treatments at 168 hr. referenced to Controls at 168 hr. (treatment effect) Treatments at 72 hr. referenced to Controls at 72 hr. (treatment effect) 1 2 3 4 8 • The range (across the 16 samples) of contribution from each spectral channel to the first and second principal component score is determined • The top contributors that account for > 90% of the observed separation are retained; this is 1089 unique spectral channels • The nonparametric Mann-Whitney test is applied to each of the 1089 unique spectral channels for each of the 4 pairs of experimental conditions. Extreme test score values indicate that all samples of one condition are separated from all samples of the other condition. It is found that 1045 of the 1089 channels satisfy this condition for at least one of the 4 pairs of comparison. • To quantify the experimental effect at each channel, we next measure the change in each of the 4 pairwise comparisons Distribution of Mann-Whitney scores for each pair of experimental conditions 1 2 • Misalignment characteristics: • identified by same pattern at different PPM values • varies across spectrum, but is not a simple linear correction • can be as much as 0.14 PPM extremes: p-value = 0.057 Above: An example showing 2 of the selected regions for 4 spectra, one from each experimental condition. number of occurrences Experiment Design and Issues 4 3 • Strategy: • divide spectra into short regions with signal bounded by segments of noise floor • choose 1 (of the 16) spectra as reference • calculate the cross correlation of each spectrum with the reference as a function of lag (i.e., offset) for each region • assemble reduced spectra by concatenating regions offset by the lag with maximum cross correlation, leaving out long segments of noise floor • In Practice: • spectra were divided into 78 regions (varying from 0.18 to 3.27 PPM in width) encompassing 43,700 of the original 131,072 points extremes: p-value = 0.029 extremes: p-value = 0.036 The hepatic metabolomic response of immature ovariectomized C57Bl/6 mice to 2,3,7,8-tetrachlorodibenzo-p-dioxin (TCDD) was examined using thin layer chromatography (TLC), 13C, 31P, and 1H NMR (14.1 T), and high pressure liquid chromatography (HPLC). Mice were treated with either sesame oil or 30 ug/kg TCDD by gavage and sacrificed at 168 hr. Treatment induced a significant increase in liver weight with marked cytoplasmic vacuolization accompanied by individual cell apoptosis and inflammation. Oil Red O staining indicated vacuolization was due to lipid accumulation and TLC analysis of lipid extracts revealed a 2.5-fold increase in triglycerides. The work reported here focuses on practical issues with analysis of the 13C lipid spectra and is based on 16 spectra from control and treated animals at 72 and 168 hour time points. 4 Mann-Whitney test score Description of full experiment and standard analysis is described in poster #738 Methodology outline: Measuring Experimental Effects 1 The experimental change for the 1045 significant spectral channels is characterized as either a relative (fold) change (left panel below) or an absolute change (right panel below) for each of the 4 pairwise comparisons. The vertical index scale tracks back to the chemical shift value of the spectral channel. This can be used to identify metabolites contributing to the experimental effect. • The work reported in our abstract has been extended in two primary directions: • Integration of intensity values (“binning”) across a span of chemical shifts that is large compared to misalignment addresses this issue but can mask the response of multiple constituents within a bin. Our extended work retains the original instrumental resolution and addresses misalignment through a regional alignment procedure. • The study compares controls and treatments at multiple time points. We have adopted a principal-components-analysis (PCA) approach to find multi-dimensional metrics of experimental effect. Above: cross correlation between samples C8(168 hr) and C11(72 hr) in region 69, 21.918 to 23.687 PPM 2 5 fold change absolute change 3 C8(168hr) 9 4 Right: An example of a reduced spectrum, containing 43,700 points 5 normalized amplitude (arb.) 6 7 8 chemical shift reduced index 9 spectral channel index change magnitude • 4 controls at 168 hr. (endpoint), labeled C7, C8, C9, C10 (C8 is used as reference) • 5 controls at 72 hr., labeled C11, C12, C13, C14, C15 • 4 treatments at 168 hr., labeled T1, T2, T3, T4 • 3 treatments at 72 hr., labeled T15, T16, T17 Sample breakdown and notation: Principal Component Analysis of Reduced Spectra • The reduced spectra from all samples were concatenated into a 43700 x 16 data matrix • The data matrix was centered by subtracting the mean data vector, then singular value decomposition was performed • The singular values (left panel below) show that the first two principal components dominate • The principal component scores were calculated for the 16 samples. A scatterplot of principal component 2 scores vs. principal component 1 scores (right panel below) shows that the data cluster by experimental conditions. The centers of the 4 clusters are indicated by the + data points • The excellent clustering of the data demonstrates that the regional alignment and size reduction methodology described above has preserved the information on experimental effect in the data. Data Preprocessing 13CNMR spectrum of lipid extract. Light blue peaks are extrinsic solvents. 1 CH3OH The 2 solvent peaks shown at left are removed by zeroing the amplitude in a region around each peak (The CDCl3 peak is actually a triplet) The spectrum at lower left expands the amplitude scale to show the noise level. A histogram of regions containing only noise (55075 points out of the total 131072) is shown below. The standard deviation is established for each sample for use when calculating significant changes in step 9 CDCl3 normalized amplitude (arb.) Conclusions 6 • The methodology outlined here successfully maintains NMR spectral resolution while dealing with “positional noise” • Principal Component Analysis of processed spectra results in excellent separation of experimental conditions and provides a means of assessing the significance of the original spectral contributions • Future work will analyze more extensive data and address identification of the observed significant spectral contributions chemical shift (PPM) 2 s = 0.0036 number of occurrences normalized amplitude (arb.) Supported by NIH / NIEHS Grant R01 ES013927 Excellent separation of the 4 experimental conditions is observed in the first two principal component scores chemical shift (PPM) normalized amplitude (arb.) ● E-mail: gary.jahns@baesystems.com● http://www.alphatech.com/primary/index.htm ● http://dbzach.fst.msu.edu