Download
1 / 3
30 likes | 46 Vues
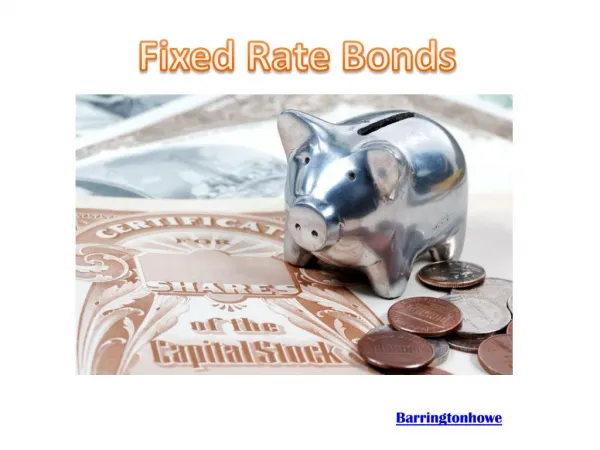
A "Fixed rate mortgage" is a home loan with a fixed interest rate for the duration of the loan. Variable-rate mortgages are available in moderate to short fixed terms.<br>Contact Bonnie Thorlakson today to discuss options & the different mortgage rates in Kelowna and surrounding area:(250) 300-4845.<br>

E N D
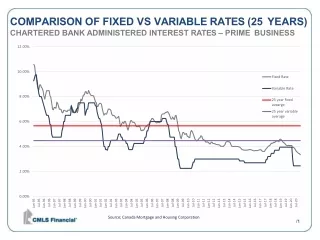
COMPARISON OF FIXED VS VARIABLE RATES (25 YEARS) CHARTERED BANK ADMINISTERED INTEREST RATES – PRIME BUSINESS 12.00% 10.00% Fixed Rate Variable Rate 8.00% 25 year fixed avearge 25 year variable average 6.00% 4.00% 2.00% 0.00% Jul-95 Jul-96 Jul-97 Jul-98 Jul-99 Jul-00 Jul-01 Jul-02 Jul-03 Jul-04 Jul-05 Jul-06 Jul-07 Jul-08 Jul-09 Jul-10 Jul-11 Jul-12 Jul-13 Jul-14 Jul-15 Jul-16 Jul-17 Jul-18 Jul-19 Jul-20 Jan-95 Jan-96 Jan-97 Jan-98 Jan-99 Jan-00 Jan-01 Jan-02 Jan-03 Jan-04 Jan-05 Jan-06 Jan-07 Jan-08 Jan-09 Jan-10 Jan-11 Jan-12 Jan-13 Jan-14 Jan-15 Jan-16 Jan-17 Jan-18 Jan-19 Jan-20 Source; Canada Mortgage and Housing Corporation /1
FIXED RATES OF THE PAST 25 YEARS AVERAGE RESIDENTIAL MORTGAGE LENDING RATE – 5 YEAR Year January February March April May June July August September October November December Average 1995 10.60% 10.48% 9.93% 9.66% 8.98% 8.67% 8.54% 8.94% 8.95% 8.75% 8.66% 8.46% 9.22% 1996 8.02% 7.79% 8.16% 8.48% 8.47% 8.48% 8.48% 8.07% 7.94% 7.50% 7.01% 6.94% 7.95% 1997 7.14% 7.12% 7.06% 7.56% 7.46% 7.22% 6.98% 7.00% 6.96% 6.73% 6.69% 6.90% 7.07% 1998 6.90% 6.84% 6.84% 6.79% 6.92% 6.90% 6.90% 7.08% 7.32% 6.73% 6.94% 6.69% 6.90% 1999 6.72% 6.79% 7.03% 6.71% 6.99% 7.35% 7.42% 7.80% 7.67% 7.90% 8.13% 8.13% 7.39% 2000 8.34% 8.43% 8.24% 8.23% 8.50% 8.34% 8.18% 8.08% 8.08% 8.08% 8.04% 7.81% 8.20% 2001 7.58% 7.52% 7.19% 7.22% 7.38% 7.47% 7.46% 7.39% 7.03% 6.74% 6.51% 6.64% 7.18% 2002 6.62% 6.59% 6.80% 7.00% 7.00% 6.98% 6.90% 6.61% 6.49% 6.50% 6.47% 6.39% 6.70% 2003 6.26% 6.29% 6.33% 6.44% 6.10% 5.62% 5.71% 5.87% 5.97% 5.83% 6.02% 6.00% 6.04% 2004 5.78% 5.51% 5.31% 5.56% 5.82% 6.06% 6.10% 5.97% 5.94% 5.95% 5.87% 5.69% 5.80% 2005 5.60% 5.59% 5.60% 5.67% 5.55% 5.31% 5.26% 5.32% 5.30% 5.39% 5.56% 5.60% 5.48% 2006 5.65% 5.75% 5.78% 5.88% 6.05% 6.12% 6.26% 6.24% 6.13% 6.01% 5.99% 5.89% 5.98% 2007 5.91% 6.00% 5.91% 5.92% 6.01% 6.51% 6.60% 6.62% 6.61% 6.69% 6.73% 6.75% 6.36% 2008 6.81% 6.72% 6.60% 6.40% 6.21% 6.20% 6.37% 6.25% 6.16% 6.46% 6.51% 6.17% 6.41% 2009 5.78% 5.28% 5.14% 4.79% 4.62% 4.90% 5.14% 5.13% 4.97% 5.00% 5.06% 4.83% 5.05% 2010 4.80% 4.73% 4.71% 5.15% 5.30% 5.18% 5.02% 4.82% 4.60% 4.52% 4.45% 4.50% 4.82% 2011 4.55% 4.68% 4.70% 4.87% 4.83% 4.60% 4.57% 4.52% 4.42% 4.35% 4.38% 4.36% 4.57% 2012 4.31% 4.23% 4.21% 4.36% 4.35% 4.25% 4.23% 4.23% 4.20% 4.17% 4.15% 4.15% 4.24% 2013 4.14% 4.11% 4.02% 4.02% 4.02% 4.00% 4.08% 4.14% 4.33% 4.40% 4.39% 4.39% 4.17% 2014 4.38% 4.32% 4.16% 4.02% 4.02% 4.00% 4.01% 4.01% 4.02% 4.00% 4.00% 3.98% 4.08% 2015 3.96% 3.91% 3.84% 3.76% 3.74% 3.72% 3.71% 3.71% 3.71% 3.72% 3.72% 3.75% 3.77% 2016 3.76% 3.75% 3.73% 3.70% 3.67% 3.66% 3.67% 3.68% 3.67% 3.68% 3.70% 3.74% 3.70% 2017 3.73% 3.75% 3.66% 3.62% 3.59% 3.60% 3.72% 3.82% 3.89% 3.98% 4.04% 4.07% 3.79% 2018 4.14% 4.26% 4.27% 4.27% 4.35% 4.32% 4.42% 4.43% 4.43% 4.48% 4.38% 4.59% 4.36% 2019 4.59% 4.52% 4.44% 4.33% 4.30% 4.23% 4.14% 4.08% 4.07% 4.09% 4.09% 4.08% 5.10% 2020 4.08% 4.08% 3.90% 3.95% 3.86% 3.77% 3.64% 3.57% 3.51% 3.45% 3.42% 3.34% 4.46% 25 year average 5.78% 5.73% 5.68% 5.71% 5.70% 5.67% 5.67% 5.67% 5.63% 5.58% 5.57% 5.53% 5.66% Source; Bank of Canada, Department of Monetary and Financial Analysis /2
VARIABLE RATES OF THE PAST 25 YEARS CHARTERED BANK ADMINISTERED INTEREST RATES – PRIME BUSINESS Year January February March April May June July August September October November December Average 1995 9.25% 9.50% 9.75% 9.75% 9.25% 8.75% 8.25% 8.00% 8.00% 8.00% 7.75% 7.50% 8.65% 1996 7.25% 7.00% 6.75% 6.50% 6.50% 6.50% 6.25% 5.75% 5.75% 5.00% 4.75% 4.75% 6.06% 1997 4.75% 4.75% 4.75% 4.75% 4.75% 4.75% 4.75% 4.75% 4.75% 5.25% 5.50% 6.00% 4.96% 1998 6.00% 6.50% 6.50% 6.50% 6.50% 6.50% 6.50% 6.50% 7.25% 7.00% 6.75% 6.75% 6.60% 1999 6.75% 6.75% 7.00% 7.00% 7.50% 7.50% 7.50% 7.50% 7.50% 7.50% 7.50% 7.50% 7.29% 2000 6.50% 6.75% 7.00% 7.00% 7.50% 7.50% 7.50% 7.50% 7.50% 7.50% 7.50% 7.50% 7.27% 2001 7.25% 7.25% 6.75% 6.50% 6.25% 6.25% 6.00% 5.75% 5.25% 4.50% 4.00% 4.00% 5.81% 2002 3.75% 3.75% 3.70% 4.00% 4.00% 4.25% 4.50% 4.50% 4.50% 4.50% 4.50% 4.50% 4.20% 2003 4.50% 4.50% 4.75% 5.00% 5.00% 5.00% 4.75% 4.75% 4.50% 4.50% 4.50% 4.50% 4.69% 2004 4.25% 4.25% 4.00% 3.75% 3.75% 3.75% 3.75% 3.75% 4.00% 4.25% 4.25% 4.25% 4.00% 2005 4.25% 4.25% 4.25% 4.25% 4.25% 4.25% 4.25% 4.25% 4.25% 4.50% 4.75% 4.75% 4.35% 2006 5.25% 5.25% 5.50% 5.75% 6.00% 6.00% 6.00% 6.00% 6.00% 6.00% 6.00% 6.00% 5.81% 2007 6.00% 6.00% 6.00% 6.00% 6.00% 6.00% 6.25% 6.25% 6.25% 6.25% 6.25% 6.00% 6.10% 2008 5.75% 5.75% 5.25% 4.75% 4.75% 4.75% 4.75% 4.75% 4.75% 4.00% 4.00% 3.50% 4.73% 2009 3.00% 3.00% 2.50% 2.25% 2.25% 2.25% 2.25% 2.25% 2.25% 2.25% 2.25% 2.25% 2.40% 2010 2.25% 2.25% 2.25% 2.25% 2.25% 2.50% 2.75% 2.75% 3.00% 3.00% 3.00% 3.00% 2.60% 2011 3.00% 3.00% 3.00% 3.00% 3.00% 3.00% 3.00% 3.00% 3.00% 3.00% 3.00% 3.00% 3.00% 2012 3.00% 3.00% 3.00% 3.00% 3.00% 3.00% 3.00% 3.00% 3.00% 3.00% 3.00% 3.00% 3.00% 2013 3.00% 3.00% 3.00% 3.00% 3.00% 3.00% 3.00% 3.00% 3.00% 3.00% 3.00% 3.00% 3.00% 2014 3.00% 3.00% 3.00% 3.00% 3.00% 3.00% 3.00% 3.00% 3.00% 3.00% 3.00% 3.00% 3.00% 2015 2.85% 2.85% 2.85% 2.85% 2.85% 2.85% 2.70% 2.70% 2.70% 2.70% 2.70% 3.00% 2.80% 2016 2.70% 2.70% 2.70% 2.70% 2.70% 2.70% 2.70% 2.70% 2.70% 2.70% 2.70% 2.70% 2.70% 2017 2.70% 2.70% 2.70% 2.70% 2.70% 2.70% 2.70% 2.95% 2.95% 3.20% 3.20% 2.70% 2.83% 2018 3.20% 3.45% 3.45% 3.45% 3.45% 3.70% 3.70% 3.70% 3.70% 3.95% 3.95% 3.95% 3.64% 2019 3.95% 3.95% 3.95% 3.95% 3.95% 3.95% 3.95% 3.95% 3.95% 3.95% 3.95% 3.95% 5.93% 2020 3.95% 3.95% 2.95% 2.45% 2.45% 2.45% 2.45% 2.45% 2.45% 2.45% 2.45% 2.45% 4.11% 25 year average 4.54% 4.58% 4.51% 4.47% 4.48% 4.49% 4.47% 4.44% 4.46% 4.41% 4.38% 4.37% 4.47% Source; Bank of Canada, Department of Monetary and Financial Analysis /3