Time Series Analysis: Components, Forecasting Techniques, and Error Measures
This document explores the fundamentals of time series analysis, detailing the components of an observation including systematic and random components. It covers various forecasting methods such as naive forecasts, moving averages, and exponential smoothing, explaining how to compute them alongside practical examples. Additionally, it provides insights into accuracy measures like Mean Absolute Deviation (MAD), Mean Square Error (MSE), and tracking signals in error detection. Overall, it serves as a comprehensive guide to understanding and applying time series analysis techniques.

Time Series Analysis: Components, Forecasting Techniques, and Error Measures
E N D
Presentation Transcript
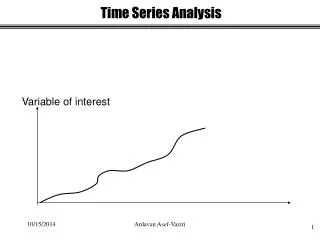
Time Series Analysis Variable of interest Ardavan Asef-Vaziri
Components of an Observation Observed variable (O) = Systematic component (S) + Random component (R) Level (current deseasonalized ) Trend (growth or decline) Seasonality (predictable seasonal fluctuation) • Systematic component: Expected value of the variable • Random component: The part of the forecast that deviates from the systematic component • Forecast error: difference between forecast and actual demand Ardavan Asef-Vaziri
Naive Forecast F(t+1) = At At : Actual valued in period t F(t+1) : Forecast for period t+1 The naive forecast can also serve as an accuracy standard for other techniques. Ardavan Asef-Vaziri
Moving Average Three period moving average in period 7 is the average of: MA73 = (A7+ A6+ A5 )/3 Ten period moving average in period t is the average of: MAt10 = (At+ At-1+ At-2 +At-3+ ….+ At-9 )/10 n period moving average in period t is the average of: MAtn = (At+ At-1+ At-2 +At-3+ ….+ At-n+1 )/n Forecast for period t+1 is equal to moving average for period t Ft+1 =MAtn Ardavan Asef-Vaziri
4-Period Moving Average at period 20, and 21 The Actual cost of a specific task type for periods 17-20 was 600, 700, 680, 720, respectively MA420 = (A20+A19+A18+A17)/4 MA420 = (720+680+700+600)/4 = 675 It was used as forecast for period 21. The actual values in period 21 is 800 MA421 = (A21+A20+A19+A18)/4 MA421 = (800+720+680+700)/4=725 MA421 = 675 +(800- 600) /4=725 MA421 = MA420 +(A21- A17)/4 Ardavan Asef-Vaziri
AS n increases, we obtain a smoother curve Micro $oft Stock Ardavan Asef-Vaziri
Exponential Smoothing Ardavan Asef-Vaziri
Exponential Smoothing α=.2 1 100 100 2 100 3 110 t At Ft 150 Since I have no information for F2, I just enter A1 which is 100 A1 F2 F3 =(1-α)F2 + α A2 F3 =.8(100) + .2(150) F3 =80 + 30 = 110 F3 =(1-α)F2 + α A2 F2 & A2 F3 A1 F2 A1 & A2 F3 Ardavan Asef-Vaziri
Exponential Smoothing α=.2 3 110 Exponential Smoothing Takes into account All pieces of actual data 1 100 100 2 150 100 4 112 t At Ft 120 F4 =(1-α)F3 + α A3 F4 =.8(110) + .2(120) F4 =88 + 24 = 112 A3 & F3 F4 F4 =(1-α)F3 + α A3 A1 & A2 F3 A1& A2 & A3 F4 Ardavan Asef-Vaziri
Smoothing constant .2 .05 The smaller the value of α, the smoother the curve. Ardavan Asef-Vaziri
Mean Absolute Deviation (MAD) The lower the MAD, The better the forecast MAD is also an estimates of the Standard Deviation of forecast s1.25MAD 10/15/2014 Ardavan Asef-Vaziri 11
Mean Absolute Deviation (MAD) 10/15/2014 Ardavan Asef-Vaziri 12
Tracking Signal Detecting non-randomness in errors can be done using Control Charts (UCL and LCL) Tracking Signal UCL Time LCL 10/15/2014 Ardavan Asef-Vaziri 13
Tracking Signal Tracking Signal UCL Time LCL 10/15/2014 Ardavan Asef-Vaziri 14
Other Measures of Forecast Error • Mean Square Error (MSE) • An estimate of the variance of the forecast error • Mean absolute percentage error (MAPE) Ardavan Asef-Vaziri
Measures of Forecast Error (MAD) Ardavan Asef-Vaziri
Measures of Forecast Error (MAR) Et = At/Ft-1 Ardavan Asef-Vaziri
FourBasic Characteristics of Forecasts • Forecasts are rarely perfect because of randomness. • Beside the average, we also need a measure of variation, which is called standard deviation • Forecasts are more accurate for groups of items than for individuals. • Forecast accuracy decreases as the time horizon increases. I see that you willget an A this semester. Ardavan Asef-Vaziri


![The Impact of [independent variable] On [dependent variable] Controlling for [control variable]](https://cdn0.slideserve.com/430545/the-impact-of-independent-variable-on-dependent-variable-controlling-for-control-variable-dt.jpg)