STATISTICS OF ONE VARIABLE
STATISTICS OF ONE VARIABLE. By: Mankiran , Jasmeet , Manahil , Jasvinder , and Josh MDM4UO Mr. Seto. 2.1 Data Analysis With Graphs. Statistics : the gathering, organization, analysis, and presentation of numerical information

STATISTICS OF ONE VARIABLE
E N D
Presentation Transcript
STATISTICS OF ONE VARIABLE By: Mankiran, Jasmeet, Manahil,Jasvinder, and Josh MDM4UO Mr. Seto
2.1 Data Analysis With Graphs Statistics: the gathering, organization, analysis, and presentation of numerical information Application: the scientific research, commercial advertising, sports, economics, etc Population: the entire group/set you wish to measure or draw conclusions from. Range: difference between the highest and lowest values in a set of data Raw Data: unprocessed information collected for study and research Sample: A “subset” of the population; the only way to analyze the population by sampling Variable: the quantity being measured Intervals: set of all numbers between two given numbers
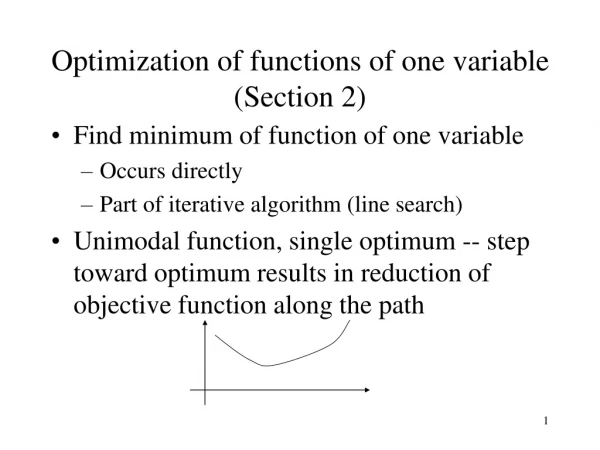
2.1 Intervals Con’t Intervals: a set of all numbers between two given numbers • Find the range=largest element-smallest element 2.
Example Here are a class’ scores obtained on a data-management examination. Construct a frequency table Find the range: 96-39= 57 Determine the number of intervals we want: 9 Interval size= range/# of intervals Interval size= 57/9= 6.3= approximately 6 Construct a histogram, frequency polygon, and Cumulative frequency polygon
Frequency Histogram Test Scores Frequency Polygon Frequency
Test Scores Frequency Frequency Cumulative Polygon
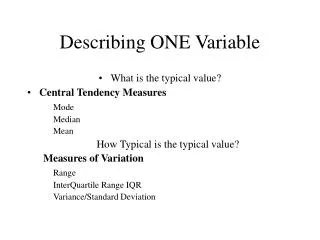
2.5 Measure of Central Tendency Mean: Sum of the values of a variable divided by the number of values Median: The middle value when they are ranked from highest to lowest Mode: The most frequent value Outlier: Datum that are distant from the majority of the data set Weighted Mean: Measure of central tendency that reflects the relative importance of the data
Ex. The following info was gathered from a group of teenagers, and the number of hours they spent on cell phone in a week. Find the mean, and mode median, from the grouped interval. Find the mean:Median: Look at number of teens which is 2.5 Mode: 2.5 =2.72
2.6 Measure of Spread Deviation is the difference between an individual value and the mean for the data Standard Deviation is the tool to measure or quantified by a number Variance is the mean of the squares of the deviations for a set of data
Example: A set of all marks for Will in calculus. Find the standard deviation and variance, using formula. • Find the mean ∑(x-u)2 = 524 Population Deviation Population Variance
Measures of Spread – Cont’d • Quartiles divide a set of ordered data into four groups with equal numbers of values • Interquartile Range is Q3 –Q1, range of the middle half of the data • Semi-Interquartile Range is Q3-Q1/2 is one half of the interquartile range • Box-And-Whisker Plot is the tool that illustrates the measures of the data • AZ-Scoreis the number of standard deviations that a datum is from the mean Z = x – μ σ Outlier Check (x-Q3) >(1.5 x IQR) or (Q1-x) > (1.5 x IQR)
Percentiles • Divide the data into 100 equally sized intervals with equal number of entriesin each interval. • To find the percentile: • Arrange the data in numerical order • Find the position of the percentile. For example, if you were competing with 100 people and scored in the 80th percentile, your position would be: 0.8x100 = 80th position.
2.4 Examples Sampling Bias Example: if a school band was surveyed on whether the funds collected for the football equipment should be given to the school band for new instruments. Non- response Bias Example: if every 10th person entering the malls main entrance was asked to volunteer to complete a questionnaire on shoes, and only 75% of these people are willing to respond. Measurement Bias Example: If Sandalwood wanted to know if lanyards are efficient methods of uniform and they asked Ms. Gyutt to stand in the main atrium and take a tally of the number of students that who actually wore or had their lanyards visible. Response Bias Example: A group of students witnessed a fellow student being bullied. The principal requests students to come forward to give insight as to what exactly happened. He fears that the other students may not want to reveal any information that they witnessed because of being labelled or targeted by other bullies.