Understanding Variable Descriptions: Central Tendency and Measures of Variation
This comprehensive guide explores the typical values associated with data through central tendency measures, including mode, median, and mean. It discusses how to evaluate the typicality of a value and introduces measures of variation such as range, interquartile range (IQR), variance, and standard deviation. Furthermore, it examines the relationships between two variables using tools such as Cramer’s V and Chi-Square tests for assessing associations and their statistical significance. Ideal for students and professionals, this resource enhances your ability to analyze and interpret data effectively.

Understanding Variable Descriptions: Central Tendency and Measures of Variation
E N D
Presentation Transcript
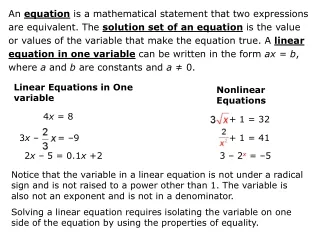
Describing ONE Variable • What is the typical value? • Central Tendency Measures Mode Median Mean How Typical is the typical value? Measures of Variation Range InterQuartile Range IQR Variance/Standard Deviation
Central Tendency Measures • What is the typical value? • Mode • most frequent value • Median • 50th percentile • Mean (Average) • ΣXi/N
Measures of Variability • How typical is the typical value? • Range • Maximum-Minimum • Interquartile Range • Difference between the 25th and 75th percentile • Variance • Average Squared Deviation from the Mean • Σ[Xi-Mean(Xi)]2/N • Corrected variance Σ[Xi-Mean(Xi)]2/(N-1)
Describing Relationships Between TWO Variables • Tables • Independent Variable Column/Dependent Variable Row • Percentage Difference • For dichotomies difference of two column percentages in the same row • Cramer’s V • For nominal variables • Gamma • For ordinal variables
Describing Associations • Strength • Percentage difference • |50%-60%|=10%
Chi -Square • (100-110)2/110+(120-110)2/110+ • (100-90)2/90 +(80-90)2/90= • 100/110+100/110+100/90+100/90=.909+.909+1.111+1.111= • 4.04 • SUM[Foij-Feij]2/Feij=Chi-Square
Cramer’s V • Cramer’s V=SQRT[Chi-Square/(N*Min(c-1,r-1)] • Cramer’s V is between 0 (no relationship) • and 1 (perfect relationship) • V=SQRT[4.04/400*1]=.1005
Evaluating Relationships • Existence • Strength, • Direction • Pattern • Statistical Significance: • Can we generalize from our sample to the population? • The values show the probability of making a mistake if we did. More precisely: The probability of getting a relationship this strong or stronger from a population where that relationship does not exist, just by sampling error.