
Uploaded by
prosper-dillard
5 SLIDES
174 VUES
60LIKES
Understanding One and Two Variable Data
DESCRIPTION
Learn about one variable data sets providing measures of a single attribute and two variable data sets giving measures of two attributes for each item in the sample through tally charts, frequency tables, and scatter plots.
Download
1 / 5
Download Presentation

Télécharger la présentation
Understanding One and Two Variable Data
An Image/Link below is provided (as is) to download presentation
Download Policy: Content on the Website is provided to you AS IS for your information and personal use and may not be sold / licensed / shared on other websites without getting consent from its author.
Content is provided to you AS IS for your information and personal use only.
Download presentation by click this link.
While downloading, if for some reason you are not able to download a presentation, the publisher may have deleted the file from their server.
During download, if you can't get a presentation, the file might be deleted by the publisher.
E N D
Presentation Transcript
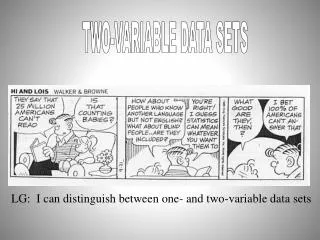
In statistics, a variable is an attribute that can be measured.
One variable data sets give measures of one attribute. • For example: • Tally charts, frequency tables, bar graphs, circle graphs.
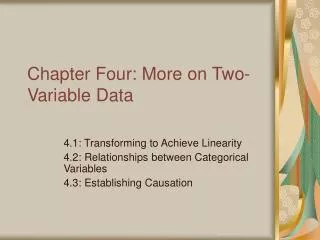
Two variable data sets give measures of two attributes for each item in the sample. • For example • Ordered pairs, • scatter plots, TOV
Pg 133 1-8


More Related
Audio
Live Player