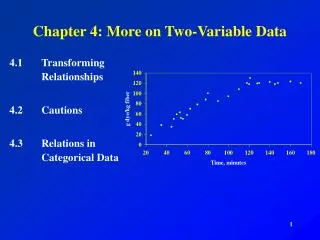
Chapter 4 - More On Two-Variable Data
Chapter 4 - More On Two-Variable Data. A.P. Statistics Block 4 Presented by: Tyesha and Kiera. 4.1 Modeling Nonlinear Data. Exponential Growth- when a variable is multiplied by a fixed number >1 in equal time period. Exponential Decay- when the ratio is a positive number <1.

Chapter 4 - More On Two-Variable Data
E N D
Presentation Transcript
Chapter 4 - More On Two-Variable Data A.P. Statistics Block 4 Presented by: Tyesha and Kiera
4.1 Modeling Nonlinear Data • Exponential Growth- when a variable is multiplied by a fixed number >1 in equal time period. • Exponential Decay- when the ratio is a positive number <1. • One Variable is proportional to a power of a second variable. • If there is both an exponential and a power function perform a logarithmic transformation. • Deviations are examined by fitting a line to the transformed points and plotting the residuals against the explanatory variable.
4.2- Interpreting Correlations and Regression • Correlations/ Regressions are powerful tools for describing the relationships between two variables. • Extrapolation- use of a regression line/curve for prediction outside the domain of values of explanatory variable x that you used to obtain the line/curve. • Lurking Variable- a variable that has an important effect on the relationship among variables but is not included among the variables being studied. • Remember: Correlations based on avgs. Are usually too high when applied to individuals.
4.2-Continued…. • Remember: High correlation does not imply causation. • Even a strong correlation does not mean that there is a cause-and-effect relationship between x and y.
4.3 Relations In Categorical Data • Two-way table- it describes two categorical variables. • Row variable- each row describes a category. • Column variable- each column describes a category.
4.3- Continued. . . • Marginal Distributions appear at the right and bottom margins of the two-way table. • Roundoff error occurs when there is an incorrect rounding in the totaled column. • Bar Chart- a graph that represents percentages/ amounts of a certain category using bars. • From a two-way table of counts, find the marginal distributions of both variables by obtaining the row sums and column sums. • Describe the relationship between two categorical variables by computing and comparing percents.
How to Perform a Logarithm • 1. Go to List 1 and key in needed data • 2. Go to list 2 and key in needed data • 3. In list 3 take the log of list 1 or X • 4. In list 4 take the log of list 2 or y • 5. Compare the results and if the graph shows a straight line then you have performed a logarithm!
Overall Summary of Chapter 4 • Key Elements of the Chapter • Performing and Understanding Logarithms • Understanding and Identifying: • Correlations • Regressions • Extrapolation/ Lurking Variables • Two-way tables and other forms of graphs