UPRM Lidar lab for atmospheric research
270 likes | 470 Vues
UPRM Lidar lab for atmospheric research 1- Cross validation of solar radiation using remote sensing equipment & GOES-13 2- Lidar and Ceilometer validation 3- Lidar overlap correction. Hamed Parsiani Professor of Electrical & Computer Engr . UPRM Luis Tavarez – BS Computer Engr . UPRM

UPRM Lidar lab for atmospheric research
E N D
Presentation Transcript
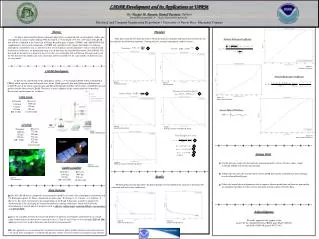
UPRM Lidar lab for atmospheric research 1- Cross validation of solar radiation using remote sensing equipment & GOES-13 2- Lidar and Ceilometer validation 3- Lidar overlap correction HamedParsiani Professor of Electrical & ComputerEngr. UPRM Luis Tavarez – BS ComputerEngr. UPRM Susana Galicia – BS ComputerEngr. UPRM (Website) Jose Nieves – PhDstudent
Cross validation of solar radiation using remote sensing equipment & GOES-13 -----------AERONET at UPRM • AERONET, was recently installed over the roof top of Stefani Building at UPRM, in-situ with the Lidar system. • AERONET tracks Sun and provides day time data, when there are little or no clouds. • Provides data every 15 minutes, • Measure solar radiation at eight wavelengths in the interval of 340 nm to 1640 nm. • Multiple products are calculated per wavelength. For cross-validation, the AERONET AOD data at 675 nm wavelength is used as it is closer to the wavelengths of GOES-13 and Pyranometer.
Cross validation of solar radiation using remote sensing equipment & GOES-13 -----------AERONET AOD data AERONET located at Stefani Building UPRM Data obtained from AERONET AOD plot obtained from AERONET
Cross validation of solar radiation using remote sensing equipment & GOES-13 -------AERONET AOD data @ 675nm • Data taken on February 5, 2013 using AERONET • Time ranging from 11:41 to 21:16 GMT • Wavelentgh used 675 nm
Cross validation of solar radiation using remote sensing equipment & GOES-13 ---------GOES-13 @ 550-750nm • The GOES-13 Satellite data over the visible range is of 1km resolution • It passes over UPRM once every 30 minutes. • Downloaded data is available in UPRM webpage http://ece.uprm.edu/noaa-crest/ corresponding to UPRM location at 18.21 N 67.14 W.
GOES-13 Satellite Picture taken from the GOES-13 satellite
GOES-13 Satellite for Feb. 5, 2013 • Data taken on February 5, 2013 using GOES Satellite • Time ranging from 11:31 to 21:15 GMT • Range of Wavelengths used from 550 to 750 nm
Solar radiation using remote sensing equipment & GOES-13 Pyranometer @ 300-1100nm • The pyranometer installed on the roof of UPRM, measures solar radiation at a wavelength range of 300 to 1100 nm. Data acquisition takes place every 10 minutes. Data from the pyranometer is more reliable around 12 noon, due to the zenith angle of the pyranometer. Pyranometer data is compared in across validation with GOES-13 data.
Pyranometer location Pyranometer installed at Stefani Building UPRM courtesy of Dr. Eric Harmsen
Pyranometer Data • Data taken on February 5, 2013 using Pyranometer • Time ranging from 11:40 to 21:20 GMT • Range of Wavelengths used from 300 to 1100 nm
Solar radiation using remote sensing equipment & GOES-13 Cross-Validation • Cross-validation is done between GOES-13 and Pyranometer and between GOES-13 and AERONET. AOD is a unit less measurement , and at many magnitudes lower than the solar radiation values. A common factor is used to raise the AOD plot to a comparable level with GOES-13 radiation plot. For the cross-validation between GOES-13 and Pyranometer, a factor needed to be implemented to obtain GOES-13 values comparable to Pyranometer data. Cross-validation was done using available data for three months, and comparing the data at near matching times, starting around 7:30 am and ending around 3:00 pm. A data matching in time of up to ± 5 minutes was searched and used in the cross validation effort.
Solar radiation using remote sensing equipment & GOES-13 Cross-Validation Cross-validation between Pyranometer, Satellite and AERONET AOD, with F1=146.2 and F2=1924
LIDAR • Data taken on February 5, 2013 using LIDAR • Data at 10:01 and 10:31 AM local time • Wavelength used 532 nm
LIDAR and GOES-13 Cross-validation between Satellite and LIDAR AOD, with F1=3083
Results & Conclusion • For data taken at 12 noon • A 19% error was observed between GOES-13 and Pyranometer, • A 12% error was observed between GOES-13 and AERONET. • The 19% error between GOES-13 and Pyranometer is due to: • a result of the pyranometer restriction of 12 noon data due to its installation at zenith angle, • the Sun was never at zenith angle with pyranometer during the measurements, • GOES-13 sensor data being an average of reflections of Sun over a 1Km foot print. • A lower 12% error is observed between GOES-13 and AERONET due to better matching between the satellite and the AERONET 675nm sensors data, since AERONET tracks the Sun. • Sensor data was an average over a range of wavelengths • GOES-13 @ 550-750nms & 1Km foot print • Pyranometer @ 300-1100nms
UPRM Ceilometer Data –May 30, 2013 Intensity plot using BL-View software Data taken on May 30th, 2013 from 10:55 am to 4:30 pm local time using Ceilometer
UPRM LIDAR Data– May 30, 2013 Power Plot of data taken on May 30th, 2013 from 1:05 pm to 1:55 pm local time using LIDAR
LIDAR and Ceilometer Comparison – May 30, 2013 • LIDAR uses three wavelengths: 1064, 355, and 532 nm 2013 May30, UPRM-Ceilometer at 910 nm Ceilometer data taken on May 30th, 2013 from 1:05 pm to 1:55 pm local time using Ceilometer Lidar data taken on May 30th, 2013 from 1:05 pm to 1:55 pm local time
LIDAR and Ceilometer Comparison – May 31, 2013 Data taken on May 31th, 2013 from 12:32 pm to 1:28 pm local time using Ceilometer Data taken on May 31th, 2013 from 12:32 pm to 1:28 pm local time
UPRM websitefor Lidar, AERONET, & Ceilometer data • At UPRM NOAA-CREST userfriendlywebsite, there are currently: • Lidar PowerPlots, raw LIDAR Backscatter data, BackscatterCoefficient, AOD, and Angstrom Coefficientplots • Link to UPRM AERONET data • Ceilometer data -- Pending • websitecouldbereached at link http://ece.uprm.edu/noaa-crest/.
Future Work • AOD validation using LIDAR and GOES-13 • AOD validation using LIDAR and Ceilometer • Water vapor mixing ratio using Lidar 407 & 387 nms • Continued updating of database for • Lidar three wavelengths • AERONET • Ceilometer CL51
Lidar overlapcorrectionusingAnsmann methodapplied to three wavelengthsJose Nieves, HamedParsiani • At the UPRM Atmospheric Research Laboratory, the backscatter-power data received from the Lidar equipment is processed and used to determine various atmospheric parameters [1,2], such as the fundamental aerosol backscatter coefficient, aerosol extinction coefficient, aerosol optical depth (AOD), aerosol size distribution (ASD), water vapor mixing ratio (WVMR), etc.. • Determination of the Lidar ratio is fundamental in the usage of equations leading to the calculations of these important atmospheric parameters. There have been multiple methods devised for the Lidar ratio determination including combining Mie and Raman scattering data if available. In this work, the Lidar ratio is determined for the three fundamental Lidar wavelengths of 355, 532, and 1064nms without the usage of the Raman channel, using AERONET AOD data. The approach in the past involved incrementing an initial Lidar ratio assumption until the error in AOD calculated by Lidar and obtained from AERONET approached zero or an acceptable value. In the present work, the initial backscatter ratio is incremented from an initial value in a nested fashion while initial lidar ratio is being incremented. At every joint variations the AOD error due to the difference of Lidar and AERONET results is obtained. A final Lidar ratio is accepted when the error has converged to a minimum value.
Fig.6 Aeronet AOD from La Parguera, used for Lidar AOD error calculation Fig.5 Lidar raw data (10:49 to 11:19AM averaged) used for the 355nm backscatter calculations Fig.7 Backscatter power at 355nm and 387nm for overlap correction Fig.8 Aerosol backscatter coefficient comparison at 355nm after overlap correction Fig.9 Aerosol Extinction coefficient at 355nm, 532nm and 1064nm Fig.10 AOT at 355nm, 532nm and 1064nm
Results & Conclusion • A proper analysis of the particles optical properties at the boundary layer is not accurate. • Boundary layer correction used 355/387nm backscatter raw data. See UPRM database at link http:/ece.uprm.edu/noaa-crest. • .The corrected backscatter elastic 355nm signal in red. This helps improve determination of atmospheric optical characterizations • Using the overlap correction method of Annsman, improvement was made for below the 1 Km range for Lidar three wavelengths of 355, 532, and 1064, extending the boundary layer data observation. • In the process of boundary layer correction, UPRM auto-determination of lidar ratio algorithm was used for each wavelengths which incorporated the AOD data from Parguera, PR AERONET. Algorithmusedfor auto-Lidar ratio determination UPRM Lidar data Feb. 15, 2012 11:31 AM
Algorithmfor Lidar ratio > Step 1: First For loop, Lidar Ratio (40 - 60) > Step 2: Second For loop, Initial Backscatter Ratio (1 – 1.1) • Calculate Aerosol Backscatter • Calculate Aerosol Extinction • Calculate Lidar AOD • Compare Lidar AOD withAeronet AOD • Calculate AOD error • Repeat step 2 for each Initial Backscatter Ratio value • Repeat step 1 for each Lidar Ratio value > Save Initial Backscatter Ratio and Lidar Ratio parameters • thatminimize AOD error > Plot AOD with saved parameters