Download
1 / 67
680 likes | 847 Vues
UWO’s Purple Crow Lidar Studies Atmospheric Change. R. Sica & P. S. Argall UWO Physics & Astronomy. Today’s Agenda. Temperature change in the lower atmosphere A brief introduction to the middle atmosphere Natural Variability Atmospheric Waves Temperature change in the middle atmosphere

E N D
UWO’s Purple Crow Lidar Studies Atmospheric Change R. Sica & P. S. Argall UWO Physics & Astronomy
Today’s Agenda • Temperature change in the lower atmosphere • A brief introduction to the middle atmosphere • Natural Variability • Atmospheric Waves • Temperature change in the middle atmosphere • Surface warming, upper air cooling • Direct measurements • Noctilucent clouds: a temperature proxy? UWO Purple Crow Lidar
PCL basics • Located at the Delaware Observatory, (42oN, 83oW) about 30’ from campus. UWO Purple Crow Lidar
System Description • Rayleigh/Raman Transmitter • Nd:YAG laser • 600 mJ/pulse • 20 pulses per second • Sodium Transmitter • Ring-dye laser pumped by the YAG • 60 mJ/pulse • 20 pulses per second UWO Purple Crow Lidar
PCL Receiver More on LMTs @ http://wood.phy.ulaval.ca/lmt/home.html UWO Purple Crow Lidar
PCL Receiver • PCL LMT is 2.65 m in diameter UWO Purple Crow Lidar
PCL Receiver Parameters UWO Purple Crow Lidar
PCL System Schematic UWO Purple Crow Lidar
Chopper Light N2 H20 Na Rayleigh PCL Detector system • Simultaneous detection of Na, Rayleigh and Raman scattering possible. UWO Purple Crow Lidar
Climate Forcing by Aerosols: Cooling • Greenhouse heating reasonably well understood. • Direct and indirect effects of aerosols are poorly understood. UWO Purple Crow Lidar
Global Warming? • Surface temperature measurements suggest anthropogenic global warming but are complicated by • natural variability • coupling with the surface • interactions with the biosphere. • Middle atmosphere COOLING may be easier to determine. UWO Purple Crow Lidar
Spheres and Pauses • Pressure decreases by 10 times every 16 km in altitude below 100 km. UWO Purple Crow Lidar
Troposphere • Most clouds exist in the troposphere, as well as most (not all!) of the water vapour. • Consider slowly lifting a small amount of air, thermally insulated from its environment, but at the same pressure (an air parcel). • The decreasing environmental pressure will cause the air parcel to expand and cool at a rate of 10 deg/km. UWO Purple Crow Lidar
Stratosphere • Stratosphere + troposphere = 99% of mass. • Home of the good ozone. • Absorption of solar radiation by ozone causes temperature to increase with height. • Residence time for stratospheric particles is years or longer. These particles include: • volcanic dust • pollutants from the troposphere • chlorofluorocarbons (CFCs) UWO Purple Crow Lidar
Mesosphere • Similar temperature structure to troposphere (e.g. decreases with height). • Mesopause region is the coldest part of the atmosphere. • Noctilucent clouds occur at 86 km altitude in the summer polar region, which is the coldest part of the atmosphere. UWO Purple Crow Lidar
-100 oC 0 oC -150 oC 40 oC Mesospheric Temperature • T < -150 oC, colder than anywhere on the surface. • Mesosphere is not in radiative equilibrium. • Gravity waves cause departure from radiative equilibrium. UWO Purple Crow Lidar
Middle Atmospheric Cooling? • The middle atmosphere is simpler than the lower atmosphere, but not simple. • The middle atmosphere is all about waves: • Planetary Waves • Tides • Gravity Waves • and on to turbulence! UWO Purple Crow Lidar
Planetary wave pattern in ozone Planetary Waves Planetary wave observed in a rotation fluid tank. UWO Purple Crow Lidar
Solar Tides Thayaparen 1995 • Solar tides are generated in the lower and middle atmosphere. • The semidiurnal tide is predominant at middle latitudes. • The diurnal tide is predominant at lower latitudes. UWO Purple Crow Lidar
WINDI Measurements of Tides at the Equator • Seasonal pattern, maximum in Northern Hemisphere summer. • These tidal modes are generated in the stratosphere by an antisymmetric pattern of ozone heating between the hemispheres. UWO Purple Crow Lidar
Tides and Temperature • Temperature calculations by the UCL Coupled Mesosphere and Thermosphere GCM for equinox conditions at 0800 and 1200 local time. • Difference in temperature between purple and green is about 20 K. UWO Purple Crow Lidar
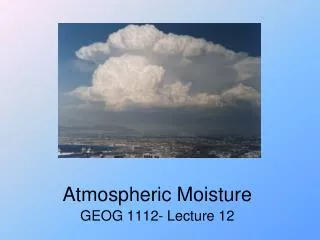
Gravity Waves • Gravity waves arise from both buoyancy and gravity acting on the air (not GR waves!). • Surface gravity waves are seen on this lake. • Gravity waves in the atmosphere are internal gravity waves. UWO Purple Crow Lidar
Observing Internal Gravity Waves • Gravity waves cause the patterns of clear sky/cloud seen in altocumulus clouds. UWO Purple Crow Lidar
Gravity Waves and Temperature Purple Crow Lidar measurements, 4 min apart @ 144 m vertical resolution http://pcl.physics.uwo.ca UWO Purple Crow Lidar
Interannual Variability • The 27 month change in direction of the stratospheric zonal wind near the equator is called the Quasi-biennial Oscillation, or QBO for short. • Labitzke and van Loon found a 10 – 12 year oscillation in the arctic stratospheric temperature in phase with the sunspot cycle when the phase of the QBO is eastward. • The result has been extended past just the arctic winter temperatures, and now over 4 solar cycles. UWO Purple Crow Lidar
Anthropogenic Temperature Change Due to Doubling CO2 • This calculation shows a standard temperature profile and a profile calculated using twice the amount of CO2 at all heights. • Note the large cooling, which proportionally is greatest near the stratopause. UWO Purple Crow Lidar
Heating Due to the Absorption of Solar Radiation UWO Purple Crow Lidar
Radiative Cooling • Most of the cooling in the middle atmosphere is due to IR radiation from CO2, primarily at 15 mm. • The cooling is largest in the warmer regions of the middle atmosphere. SOCRATES model, Bresseur et al. UWO Purple Crow Lidar
Comparison of Radiative Heating & Cooling • Shown is the vertical distribution of shortwave heating and longwave cooling rates in the lower and middle atmosphere. • The net radiative heating or cooling is quite small! UWO Purple Crow Lidar
Effect on Temperature • Calculated temperature difference compared to the present with double (solid) and half (dashed) the present amount of CO2 using the NCAR Thermospheric GCM. • A 50 K change in temperature appears huge, but the temperature here is about 750 K (7% decrease). At the stratosphere the difference is about 15 K, about the same % difference. Roble & Dickinson, 1989 UWO Purple Crow Lidar
IPCC 2001 Temperature Change (K) Evidence for Stratospheric Cooling • Lower stratosphere temperature change for the UKMO model and the MSU 4 and SSU15X satellites. • General trend is cooling. • Heating during major volcanic eruptions is evident. UWO Purple Crow Lidar
Stratospheric Temperature Change • Mean vertical profile of the temperature trend over the 1979-1994 period in the stratosphere at 45°N, as compiled using radiosonde, satellite and lidar datasets. • The solid red line indicates the trend estimate while the dashed lines denote the uncertainty at the 2s level. From the SPARC assessment UWO Purple Crow Lidar
Middle Atmosphere Change from Lidar Measurements • Temperature trend measurements from OHP Rayleigh lidar from 1979 – 1998. • The dashed curves mark the 2s uncertainty. UWO Purple Crow Lidar
Just for Fun: PCL “trends” UWO Purple Crow Lidar
Noctilucent Clouds • NLC typically occur at latitudes above 50o N, usually in the summer. • They also have counterparts in the Southern Hemisphere. • They always occur in the 83 to 88 km altitude region. • Composed of small water-ice particles grown in extremely cold temperatures (120 to 140 K). • NLCs appear to occur more frequently during solar minimum. • Structure in this picture is the interaction of gravity waves with the clouds. UWO Purple Crow Lidar
NLCs at Middle Latitudes • Recently, creditable reports of NLCs at latitudes as far south as 40o have been received! Photo by Mike Taylor Wickwar et al. [2002] UWO Purple Crow Lidar
0 Increasing Occurrence of NLCs? • Gadsen’s compilation of NLC sightings versus time (though some disagree with it). • The number of NLCs has doubled during the past 35 years. Gadsen [1997] UWO Purple Crow Lidar
What Would Cause the Increase? • Two schools of thought here • Decreasing Mesopause Temperatures If the mesopause temperature is decreasing more extended and brighter cloud displaces could occur. Implication: increasing numbers of NLCs are a direct proxy for global warming. UWO Purple Crow Lidar
What Would Cause the Increase? • Increasing Mesospheric Water Vapour • HALOE measurements of water vapour show increases of 0.2 to 0.6% per year in the stratosphere. • Shaded regions are statistically significant increases of water vapour. 1992 - 2002 UWO Purple Crow Lidar
Water Vapour and NLCs • Any connection of NLCs to anthropogenic change is more complicated for changes in water vapour, although increases of water in the middle atmosphere is consistent with surface warming. • Sources of water vapour in the mesosphere • Volcanoes (though increases in NLC sightings did not occur after El Chichon and Mt. Pinatubo) • Tropospheric water vapour (half of stratospheric water vapour comes from the troposphere) • Methane (gets converted to water vapour by solar UV radiation) • Solar cycle effects on water vapour via photodissociation in the mesosphere (due to changes in Lyman-a flux at 121.6 nm) UWO Purple Crow Lidar
Summary • The middle atmosphere, comprised of the stratosphere, mesosphere and lower thermosphere, extends from 15 to 110 km altitude. • The middle atmosphere is a fruitful place to search for climate change relevant to the lower atmosphere. • Initial studies of cooling in the middle atmosphere are consistent with estimates of warming at the surface. UWO Purple Crow Lidar
Thanks to Steve Argallfor lots of interesting discussions on this stuff! UWO Purple Crow Lidar
You asked! The (Purple) Crow and the Pitcher Dying of thirst, a Crow suddenly gave a cry of pleasure. “Caw! Caw!” he cried. “A pitcher! A pitcher of water!” It was indeed a pitcher, and there was water in it. But it was a large pitcher, and the water left in it was at the very bottom. The Crow could not reach down far enough to get a single sip. “Perhaps,” he said to himself, “if I push it over, the water would lie on the side and I would have no trouble getting a drink.” UWO Purple Crow Lidar
He took a pebble from the garden, carried it in his beak, and dropped it in the pitcher. The level of water rose a little. Then he brought another pebble and dropped that one in, too. The water rose higher. Then he brought another, and the water rose to the top of the pitcher. But the pitcher was heavy and the Crow was not able to move it at all. He was just about to give up when he thought of something which showed what a clever Crow he was. With a happy gurgle, he planted his claws firmly on the rim of the pitcher and had one of the best drinks a Crow had ever had in his whole life. with thanks to Aesop and Black Bird Creations UWO Purple Crow Lidar
Intermittency in the Middle Atmosphere Red is 1000 J/m3, Blueis less than 2.5 J/m3 http://pcl.physics.uwo.ca UWO Purple Crow Lidar
The BigPicture • Thunderstorms at the equator force air from the troposphere to the stratosphere. • Air is then "pumped" to the poles. • The air cools and descends at the poles. • Storms mix the air back into the troposphere. UWO Purple Crow Lidar
General Circulation • A computer model developed by Dr. A. Douglas and colleagues (NASA) shows the transport of a tracer gas. • The gas moves from the summer to winter pole due to the winds. UWO Purple Crow Lidar
Thanks! UWO Purple Crow Lidar
The Quasi-biennial Oscillation • The QBO is an example of interannual variability in the middle atmosphere. • The QBO is a curious modulation of the lower stratospheric zonal wind in the equatorial Pacific. • Some characteristics of the QBO • Zonal winds change direction with a period of oscillation from 20 to 36 months, with a mean of around 28 months. • Westward phase is generally greater than the eastward phase. • There is considerable variability of the QBO in period and amplitude. UWO Purple Crow Lidar