Open source tools for data analysis
Learn how to optimize data analysis workflow in proteomics using open source tools such as OpenMS, KNIME, R, and Perseus. Explore tips for mzTab conversion, peptide identification, and interpreting results. Improve QC experiments and cross-platform data analysis for better reproducibility. Plan for a phase II workflow for broader distribution among participants with qcML output.

Open source tools for data analysis
E N D
Presentation Transcript
Achim Treumann Open source tools for data analysis
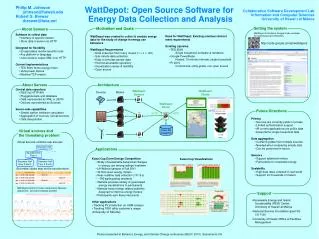
General Workflow Data will now be mzIdent and mzTab Using OpenMS (knime version) perform MSGF+ searches Download all data from MassIVE Using msconvert convert to mzML Using R convert mzTab results into more accessible peptide.tsv (thanks to Julianus Pfeuffer) Using Perseus generate heatmap Using R perform a full join of the q-values for all files into one large table
msconvert Part of the proteowizard suite: http://proteowizard.sourceforge.net/tools.shtml • Used default parameters for conversion of all files into mzML • This retains most (all?) of the information in the files, including metadata about data acquisition • Proteowizard does use libraries that have been supplied by MS manufacturers • Files increase in size between 1.5 and 6-fold (file sizes for HeLa digests between 0.5 GByte and 8 GByte. This can be avoided by specifying the number of peaks per MSMS spectrum (600 is sensible) in the conversion process • 42 files converted
OpenMS • Platform that allows you to do almost everything with your MS data (particularly within proteomics) • Works with data from all manufacturers • Tutorial is here:http://open-ms.sourceforge.net/wp-content/uploads/2016/01/handout1.pdf • Used this to search all datasets and calculate FDR
OpenMS • Workflows are constructed within Knime (v 3.3.1) • Each worknode can have many parameters that can be set (e.g. for a search) • Default parameters do not always work and need to be tuned, but it is possible to generate a workflow that produces results for all datasets
mzTab tsv conversion • The default output for search results is mzIdentML, a format that is great for computers and contains all metadata, but not very human readable or useable • A more usable output standard is mzTab • mzTab contains protein lists and peptide lists in one mixed table – not good for further processing • Julianus Pfeuffer and Lars Nilse (OpenMS team) have written and R script that I have modified to generate a table of only peptide results, discarding Q-Values > 0.01. • This script is called make_tsv.R and it generates files that are called psm.tsv (one file for each dataset) • Now not necessary anymore – the OpenMS team has developed an improved mzTab exporter
Summarise all data • All psm.tsv files were pulled together in one large file that contains all identified peptides (q<0.01) • Using the dplyr library in R, we performed a full join of all individual tables and extracted for each dataset only the Q-Value (as a measure of identification confidence) • Then we used Perseus to visualise the data in a heatmap
Visualise results • Results could be visualised using an R script, but I did not have time, so we used Perseus (not open source, but free for academics and several papers published) • Perseus tutorials and lectures on youtube:http://www.coxdocs.org/doku.php?id=perseus:user:tutorials
Heatmap of peptide identifications • Red colour codes for high confidence identifications, blue for lower confidence • Grey are missing values • Clustering was performed with a Euclidean distance function • I think that this heatmap does show reasonable reproducibility • Don’t know yet for sure how to get the best interpretation
Conclusions • We have learnt a great deal about improving our QC experiments and procedures • Cross-platform data analysis for QC is difficult, but can be implemented • Commercial standards (external or internal) cost money, but are important (cross-laboratory reproducibility) • ID based and non-ID based QC parameters are very complementary • For phase II we want to produce a generally applicable data analysis workflow that can be distributed to all participants (providing qcML output)