Memory Debugging and Code Coverage Tools Overview
Learn about dynamic and static source code analysis tools, memory debugging risks, code coverage metrics, and dynamic code analysis tools for C++ and Java. Discover best practices and tools for ensuring software quality.

Memory Debugging and Code Coverage Tools Overview
E N D
Presentation Transcript
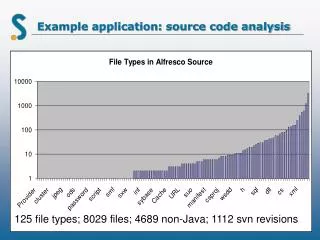
Source Code Analysis Tools Philippe CHARMAN charman@fr.ibm.com http://users.polytech.unice.fr/~charman/ Last update: 07-02-2013
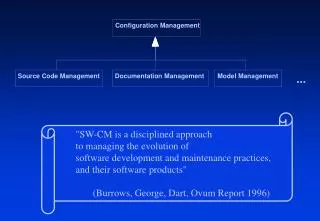
Source Code Analysis Tools • Dynamic Source Code Analysis Tools • Memory Debugger • Profiler • Code coverage • Static Source Code Analysis Tools • Code Metrics • Coding Guidelines • Formal methods
Dynamic Source Code Analysis • Definition: Analysis of computer software that is performed by executing programs • For dynamic program analysis to be effective, the target program must be executed with sufficient test inputs to produce interesting behavior • Main types: • Memory debugger • Code coverage • Profiler
C++/Java Memory Debugger • Memory errors are hard to debug • When to use memory debuggers • When bugs are not always reproductible • When the application crash and there’s too few information from the call stack to be able to debug • When the memory consumption increases too much or too fast • How do they work • Most of them instrument the object code or the source code • In some rare cases, the instrumentation can have unexpected side effects on the code execution or can be done at all • What are the risks • Memory errors are the most commonly used means by which attackers attempt to gain control over an application
Bugs found by C++/Java Memory Debuggers • Memory corruption (C++) • Reading/writing outside the bounds of an array • Reading a null pointer • Trying to free non-allocated memory • Memory unitialized (C++) • Memory allocator/deallocator mismatch (C++) • Memory leaks (C++ mainly) • Allocated memory not freed • Be careful on the false positives • Good practice: use at least 2 memory debuggers to collect more bugs
Some memory errors • Writing overflow memory char z[10]; strcpy (z, "A simple test"); • Null pointer read char buf[BUFSIZ]; char *p = fgets(buf, sizeof(buf), stdin); printf("p[0] is %d\n",p[0]); • Function mismatch char *a; a = new char; free(a); • Uninitialized memory read int x; int y = x*x +1;
Code Coverage Tools • Compute the metrics for estimating the degree to which the source code of a program has been tested • Two main coverage metrics : • Function coverage • Line coverage • Other less used coverage metrics • Decision coverage • Condition coverage • Path coverage • etc. • White Box Testing • Code coverage is one consideration in the safety certification of avionics equipment.
Code Coverage int f(int x, int y) { if (x < 0) { a = 1; } else { a = 2; } if (y < 0) { b = 1; } else { b = 2; } return a*b; }
Line Code Coverage int f(int x, int y) { if (x < 0) { a = 1; } else { a = 2; } if (y < 0) { b = 1; } else { b = 2; } return a*b; } f(1, 2); f(1, -1); f(0, 0); 6 lines covered 1 line uncovered 86% lines covered
Path Code Coverage int f(int x, int y) { if (x < 0) { a = 1; } else { a = 2; } if (y < 0) { b = 1; } else { b = 2; } return a*b; } f(1, 2); f(1, -1); f(0, 0); 2 paths covered 2 paths uncovered 50% path covered
Code Coverage Tools • Good practice: code coverage from the low levels of code • Rather costly activity especially for large systems • The trend of the coverage level is more important than the level itself
Performance Analysis Tools • Goals: • improve performance • detect bottleneck • White box testing (finer analysis) • Results can be displayed as • Flat: list of functions/methods • Detailed: all information related to a specific function/method • Call graph results
Dynamic Code Analysis Tools for C++ and Java • Usually comes with a suite of tools • Memory debugger • Code coverage • Perfomance analysis
Some Dynamic Code Analysis Tools for C++ • IBM Rational PurifyPlus 7.0 • First version in early 90’s • Available on Windows, AIX, Linux, Solaris, HP-UX • Can be integrated in Visual Studio • Instrument the object code
Some Dynamic Code Analysis Tools for C++ • MicroFocus DevPartner Studio • Available on Windows only • Support x64 architecture • Can instrument the object or the source code
BoundsChecker Report BullseyeCoverage
Some Dynamic Code Analysis Tools for C++ • Valgrind • Available on Linux and Mac OS X but not yet on Windows • Open source project
Some Dynamic Code Analysis Tools for C++ • Others: • Parasoft Insure++ • AQTime • Intel VTune Performance analyzer (profiler only)
Demo of IBM Rational Purify Simple C++ code: #include <string> #include <iostream> using namespace std; int main() { int i; size_t length; char *string1 = "Hello, Windows"; char *string2 = (char*) malloc(10); length = strlen(string2); for (i = 0; string1[i] != '\0'; i++) { string2[i] = string1[i]; } length = strlen(string2); cout << string2 << endl; return 0; }
Some Dynamic Code Analysis Tools for Java • JProbe • Optimize It • Atlassian Clover (code coverage only) • MicroFocus DevPartner Java Edition • IBM Rational PurifyPlus for Java
Static Code Analysis Tools • Definition: analysis of source code that is performed without executing it • What can they do • Compute code metrics • SLOC, cyclomatic complexity, etc. • Check coding rules • Misra C/C++, JSF, etc. • Find bugs or security vulnerabilities
Code Volume Metrics • Basic metrics • Number of lines of source code • Number of lines containing executable source code • Number of lines of comments • Number of functions, methods, classes • Number of files • etc. • Derived metrics • Average number of lines per function, method • Comment to code ratio • Test code lines to source code lines ratio • etc.
Code Complexity Metrics • Basic complexitymetrics • Cyclomaticcomplexity for eachmethod/function • Nesting level of control constructs • Maximum depth of class in inheritance tree • Derivedmetrics • Maximum cyclomaticcomplexity • Averagecyclomaticcomplexity • Maximum nesting level of control constructs • Correlation to number of bugs
How To Use Code Metrics • Specific uses • Variation of SLOC between versions • Variation of SLOC between the code freeze and the release • Variation of test code lines to source code lines ratio between versions • Common mistakes • Metricsdrivenstrategy • Focusingonly on the code coveragelevel • Trying to estimate a developerproductivitywrthis SLOC
Coding Rules • Potential bugs: • Test equality for floating point • Virtual Function Call In Constructor/Destructor • Switch Has Default • etc. • Unused code: • Unused Functions • Unused Local Variables • Unused Static Globals • Cosmetic layout
Coding Rules • Best pratices: • Functions Too Long • Overly Complex Functions • Variables should be commented • Do not use #define to specify types • Use const whenever possible • Definitions in Header Files • Scope Hiding • Inline Functions have more than X LOC • Etc.
Some Coding Guidelines Tools • CheckStyle (Java) • IBM Rational Software Analyser (C++, Java) • Understand (Ada, C/C++, C#, Cobol, Fortran, Java, Pascal, etc) • Parasoft C++ test (C++) and Parasoft JTest (Java) • etc.
PC-lint and FlexeLint for C/C++ • First version in 1985 • Code analysis dedicated to finding bugs • Not a coding rule tool • Demo at: http://www.gimpel-online.com/OnlineTesting.html
Bug Found by PC-lint This program is likely to crash: const char *flowers[] = { "rose", "tulip", "daisy" "petunia", "orchid", "lily" }; int main() { int i; int choice; for( i = 0; i < 25; i++ ) { choice = rand() % 6; printf( "%s\n", flowers[choice] ); } return 0; }
Bug Found by PC-lint This code displays: 20/4 == 20 int quotient(int *q, int *p) { if(*p) return *q/*p /* compute ratio */ ; else return *q; } int main() { int n = 20, m = 4; int q = quotient( &n, &m ); printf( "%d/%d == %d\n", n, m, q ); return 0; }
Bug Found by PC-lint • This program displays: The triangular sum is 12 int a[3][3] = { {1,2,3}, {4,5,6}, {7,8,9} }; int sum( int a[3][3] ) { int i=0, j=0, k=0; for ( i = 0; i < 3; i++ ) { for ( i = 0; i < 3; i++ ) { k += a[i][j]; } } return k; } int main() { printf( "The triangular sum is %d\n", sum(a) ); return 0; }
Formal Methods Tools • Used rather for embedded systems (car, planes, missiles, medical devices etc.) • More efficient on small/medium volume of code
Formal Methods Tools • Commercial tool: • Polyspace • Some open source tools: • ARCHER (ARray CHeckER) • BOON, • Splint • UNO • Comparison of formal method tools: • http://www.ll.mit.edu/mission/communications/ist/corpora/KratkiewiczThesis.pdf
Further reading • http://en.wikipedia.org/wiki/Therac-25