Download
1 / 50
510 likes | 971 Vues
Unit 6: Chemical Properties of Water. H 2 O molecule. Two hydrogen H and one oxygen O atoms bonded by sharing electrons Both H atoms on same side of O atom Resembles Mickey Mouse. Hydrogen bonding. Water is Polar

E N D
H2O molecule • Two hydrogen H and one oxygen O atoms bonded by sharing electrons • Both H atoms on same side of O atom • Resembles Mickey Mouse
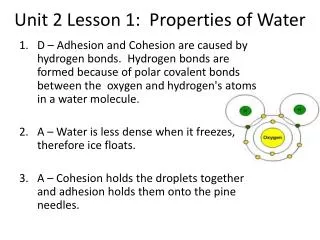
Hydrogen bonding • Water is Polar • That means that there is a small negative charge at O end, and a small positive charge at H end (like a magnet) • There is an attraction between + and – ends of water molecules to each other or other ions • This makes water the universal solvent. Fig. 5.3
Solutions SOLUTE Substance that is being dissolved SOLVENT Substance into which the solute dissolves
Cohesion • Molecules of same chemical make up that are attracted to each other • Water likes each other because: • the hydrogen bonds - hold water together • polarity
Surface Tension • Is a measure of how difficult it is to stretch or break the surface of a liquid • Needle floats, water striders • High surface tension is important for waves • Add salt increases surface tension • Decreased temperatures increases surface tension; Increased temp decreases surface tension.
Adhesion • Attraction between two different substances. • Water will make hydrogen bonds with other surfaces such as glass, soil, plant tissues, and cotton.
Water molecules in different states of matter- See the spread of molecules with heat? Fig. 5.5
Changes of state due to adding or subtracting heat • Heat is energy of moving molecules • The more heat, the faster the molecules move • The less heat, the slower the particles move
Heat Capacity • Water has a high heat capacity • Heat Capacity is the ability of a substance to hold heat. • Amount of heat needed to raise or lower 1g of a substance 1° C • The value is proportional to the amount of a substance. • Ex. A tub of water vs. the ocean • Heat is energy, and measured in calories
Heat Capacity con’t. • Salt water has an even higher heat capacity. Saltwater freezes at -2ºC, rather than 0ºC • A calorie is the amount of heat needed to raise the temperature of 1 gram of water by 1° C • [Kcal (1000 calories) = 1 food calorie]
Density of water • Recall: D=m/v (g/m³) • Density of water increases as temperature decreases (the colder the water, the more compact the molecules are) • Density of ice is less than density of water (that’s why ice floats). • Why?
Note how water molecules are farther apart than in liquid water
Density of seawater • Sea water has salt dissolved in it, so it is denser than pure water • Ocean layered according to density • Density seawater controlled by temperature, salinity, and pressure • Most important influence is temperature
Less dense substances float on denser substances • Dry pine wood floats on water • Oil floats on water • Fresh water floats on salt water • Warm water floats on cold water
Effect of Salt on Density • Dissolved materials increase density of water (more mass per unit volume) • Pure water: D = 1.000 g/mL • Fresh water: D = 1.010 g/mL (approx.) • Sea water: D = 1.0278 g/mL • [at 4° C]
Pressure • Increases with depth • For every 10 m (33 ft.) in depth the pressure increases by 1 atmosphere • 1 atmosphere = 14.7 pounds per square inch
Light • Visible light is narrow band of electromagnetic spectrum • Visible light is broken into rainbow ROY G BIV
Visible Light & Seawater • 60% is absorbed in 1st meter • 80% is absorbed by 10 m (33 ft) • 99% is absorbed by 150 m (500 ft) • 100% is absorbed by 1000 m (3300 ft)
Why is the Sea Blue? • Color = reflected light • Red end of spectrum absorbed • Blue-green end reflected back • We see the reflected blue end of the spectrum • ROY G BIV Absorbed Reflected back
Refracted Light in Water • Light is bent because the speed of light is faster in less dense air than in denser water • Objects seen through waters surface are not where they appear to be Pencil in water experiment; appears that the pencil is broken when in reality the light travels through water slower and reaches your eye at a different time than the light traveling through the air.
Sound • Travels faster in water than air • Velocity 1500 m/s (5000 ft/s) • In dry air 334 m/s (1100 ft/s) • Speed increases if: • Temperature decreases • Pressure increases • Salt increases
SONAR(Sound Navigation & Ranging) • Underwater location system • Locates objects and finds targets • Echo reflected from target • Sound shadows formed • Sound changes speed as passes through different densities of water
• 1. What happens to salinity when sea ice forms? What about in an estuary? • 2. How deep are you if you are 20 atmospheres below sea level? • 3. What causes light to be refracted in water? • 4. What is the ocean’s average salinity? • 5. Why are some icebergs green?
Salinity • Total amount of solid material dissolved in water • Typical salinity is 3.5% or 35o/oo • Six elements make up 99% of dissolved solids in seawater Fig. 5.12
Salinity variations • Open ocean salinity 33 to 38 o/oo • Coastal areas salinity varies more widely • Influx of freshwater lowers salinity or creates brackish conditions • Greater rate of evaporation raises salinity or creates hypersaline conditions • Salinity may vary with seasons (dry/rain)
How to change salinity • Add water • Remove water • Add dissolved substances • Remove dissolved substances
Precipitation (rain or snow) Runoff (river flow) Melting icebergs Melting sea ice Evaporation Formation of sea ice Processes that add/subtract water from oceans Salinity increases through: Salinity decreases through:
Hydrologic cycle describes recycling of water near Earth’s surface Fig. 5.15
River flow Volcanic eruptions Atmosphere Biologic interactions Salt spray Chemical reactions at seawater seafloor interface Biologic interactions Evaporite formation Adsorption Processes that add/subtract dissolved substances Salinity increases through: Salinity decreases through:
Residence time • Average length of time a substance remains dissolved in seawater • Ions with long residence time are in high concentration in seawater • Ions with short residence time are in low concentration in seawater • Steady state condition
Residence time and steady state Fig. 5.16
Acidity and alkalinity • Acid releases H+ when dissolved in water • Alkaline (or base) releases OH- • pH scale measures acidity/alkalinity • Low pH value, acid • High pH value, alkaline (basic) • pH 7 = neutral
Carbonate buffering • Buffer-A substance that prevents sudden or large change in the acidity or alkalinity in a solution. • Carbon acts as a buffer in the ocean • Keeps ocean pH at about 7.5-8.5 (slightly alkaline) • pH too high, carbonic acid releases H+ • pH too low, bicarbonate combines with H+
Carbonate buffering Fig. 5.18
Surface ocean variation of salinity • Polar regions: salinity lower, lots of rain/snow and runoff • Mid-latitudes: salinity higher, high rate of evaporation • Equator: salinity lower, lots of rain • Thus, salinity at surface varies primarily with latitude
Surface ocean variation of salinity Fig. 5.20
Deep ocean variation of salinity • Surface ocean salinity is variable • Deeper ocean salinity is nearly the same (polar source regions for deeper ocean water) • Halocline, rapid change of salinity with depth
Salinity versus depth Fig. 5.21
Desalination processes • Remove salt from seawater • Distillation--most common process • Electrolysis • Reverse osmosis • Freeze separation