Texas Water Resources: Challenges and Solutions
Explore Texas' water issues and resources, its physical and socioeconomic profile, legal and institutional frameworks, climate characteristics, and regional challenges, including water demand and supply projections. Learn about water conservation, groundwater management, surface water strategies, and the vision for hydrological development in Texas.

Texas Water Resources: Challenges and Solutions
E N D
Presentation Transcript
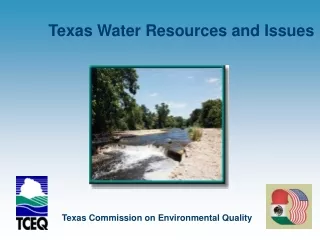
Texas Water Resources and Issues Texas Commission on Environmental Quality May 2006
Area and geographic boundaries 261,797 square miles 254 counties; 1210 cities and towns 23 major river basins Borders South: Mexican states of Chihuahua, Coahuila, Nuevo León, and Tamaulipas North: Oklahoma West New Mexico East Arkansas and Louisiana Ranges from Mountainous to Subtropical desert or tropical areas Physical and Socioeconomic Profile
Population 20,851,820 million (2000) 2,125,464 million inhabitants along the border region McAllen-Edinburg-Mission 4th fastest growing metro statistical area in the country Border city growth expanded near 50% in ten years (Mexican Side) Socioeconomic conditions Principal activities: agriculture, ranching, oil and gas production, trade and commerce, industry and tourism Of the 35 poorest US counties (per capita income) 13 are in the Texas portion of the border area Physical and Socioeconomic Profile
In Texas, surface water and ground water are property rights. Surface water belongs to the state Permits to appropriate surface waters are granted by the Texas Commission on Environmental Quality (TCEQ). Ground water is an individual property right, established by case law. However, state law empowers local or regional groundwater management authorities and states that Groundwater Conservation Districts are the preferred method of groundwater management. Legal Framework
Federal Law Clean Water Act: Primary legal Protection for the nation’s water Federal Agencies U.S. Environmental Protection Agency Federal oversight of surface water and drinking water quality programs Oversight of state efforts to regulate solid waste landfills and hazardous waste sites U.S. Natural Resources Conservation Service Conservation and improvement of natural resource use on private lands Manages and mitigates agricultural non-point source pollution U.S. Geological Survey of the Dept of the Interior Water quality monitoring and assessment Data collection and analysis Institutional Framework
Principal State Agencies Texas Commission on Environmental Quality Establishes water quality standards on a triennial basis, subject to EPA approval. Water quality standards are set on a segment by segment basis Texas Water Development Board International Boundary and Water Commission, U.S. Section Special districts include water control and irrigation districts and groundwater conservation districts Nonprofit water supply corporations Institutional Framework
Mexican Water Quality Institutions Comisión Nacional del Agua Manages Mexico’s water resources including quality monitoring and protection International Institutions International Boundary and Water Commission Entity with U.S. and Mexico sections that oversees 1944 Water Treaty Border Environment Cooperation Commission and North American Development Bank Assist communities with environmental infrastructure for border region Institutional Framework
Regional Programs—Rio Grande and South Texas • Watermaster Programs • Ensure compliance with water rights by monitoring stream flows, reservoir levels, and water use. • Coordinate diversions in the basins managed by their programs. • Regulate reservoirs as needed to prevent the wasting of water or its being used in quantities beyond a user's right.
Climate Characteristics: desert with less arid and more tropical climate as the Rio Grande flows toward the Gulf of Mexico. Average annual rainfall ranges from 9.43 inches in El Paso to 60.57 inches in Jasper County Border region is generally warm and windy. Border has experienced prolonged drought Regional Conditions
Average Statewide Texas Monthly Precipitation and Temperature (2005)
In West Texas, the amount of water being recharged is minimal Arid conditions and growing population increase concerns about water use The right to use aquifer waters that cross political boundaries is an issue, especially in the tri-state area Several counties in the Rio Grade basin rely on groundwater for more than 55% of their water needs Groundwater
The population of Texas is expected to nearly double in the next 50 years, from 21 million (2000) to 40 million (2050). Total projected demand for water is expected to increase 18% from nearly 17 million acre-feet in 2000 to 20 million acre-feet in 2050 Regional Challenges: Water Demand
Water supplies from existing sources are expected to decrease 19% from 17.8 million AFY in 2000 to 14.5 million AFY in 2050. Water supplies from existing groundwater sources are expected to decrease 19% from 8.8 million AFY in 2000 to 7.2 million AFY in 2050. Regional Challenges: Water Supply Projected Water Supply From Texas Aquifers 2000-2050
Water Conservation Groundwater Management Strategies Surface Water Management Strategies Reuse Desalination Others Texas Vision for Hydrological Development
More water-efficient irrigation practices Voluntary transfer of surface water rights from agricultural users to municipal users. Change crop varieties and types Utilization of genetic engineering Voluntarily conversion of irrigated acreage to dry-land production Utilization of conservation tillage methods Installation of efficient irrigation equipment Lining of irrigation canals Additional conservation techniques include laser leveling of fields and automated water delivery control systems. Texas Water Conservation Strategies
Installation of new wells (most common groundwater management strategy) New wells would produce about 631,000 AFY by 2050. Strategies for additional pumping of existing wells Additional supply of approximately 122,000 AFY Artificial recharge strategies Additional supply of 26,000 AFY in 2050. Groundwater transfers (long distance transfers through pipelines) Texas Groundwater Management Strategies
Expanded use or acquisition of existing supplies Reallocation of reservoir storage for new uses Voluntary redistribution of existing water resources Enhance yields of existing sources Interbasin transfers Major reservoir development Texas Surface Water Strategies
Reuse Reuse of wastewater would result in 423,268 AFY of additional water supplies by 2050. Desalination desalination of brackish groundwater would provide 66,954 AFY in additional supplies Desalination of coastal waters would provide an additional 84,012 AFY Region B included desalination in two recommended water management strategies for a total of 28,808 AFY. Texas Reuse and Desalination
Weather modification Brush control Aquifer storage/recovery Contract renewals from systems with a mixed supply of groundwater and surface water Other Texas Strategies
Statewide Comparison of Supply versus Demand (with and without Regional Water Plan Implementation)
La Paz Agreement provides legal framework for Border 2012 program Empowers federal environmental authorities in the U.S. and Mexico to undertake cooperative initiatives Border region is home to 11.8 million inhabitants Projected growth rates exceed anticipated national average In some cases by more than 40% If current trends continue border population is expected to increase by 7.6 million people by 2020 U.S.-Mexico Border Profile
Allocates, monitors and controls the use of surface water to municipal/domestic, industrial, agricultural and other user storage accounts in the Rio Grande Basin Allocations are based on the available water in storage in Falcon and Amistad Reservoirs Area encompasses 1173 river miles of the Rio Grande, 382 stream miles of U.S. tributaries and approximately 1600 water right accounts. Area is downstream of Fort Quitman in Hudspeth County to the Gulf of Mexico. Works closely with water rights holders. TCEQ Rio Grande Watermaster
Major Aquifers—Border Region Cenozoic Pecos Alluvium Edwards-Trinity (Plateau) Hueco-Mesilla Bolson Carrizo-Wilcox Gulf Coast
Combined Capacity in Rio Grande International Reservoirs Source: International Boundary & Water Commission www.ibwc.state.gov/wad/IMAGES/amfalpct.gif
Available Water Supplies—Rio Grande Water Planning Region (Region M)
Rio Grande Water Planning Region encompasses eight counties and portions of three river or coastal basins Water users are located in all three of these basins but practically all rely upon surface water from the Rio Grande or groundwater for their water supplies. Basin Areas—Rio Grande Water Planning Region (Region M)
Rio Grande Water Planning Region (Region M): Projected Water Demand
Water Quantity Issues Sparse rainfall Increasing Water demand Water Quality Issues High salt and nutrient content lessens optimal quality Levels of bacteria exceed standard for contact recreations (after treatment water meets public water supply and irrigation standards) Subregion Analysis of Current Conditions: Upper Rio Grande (New Mexico Border to Amistad)
Current Needs Long-range, strategic water quality and quantity planning Institutional water initiatives, data sharing and conservation Wetlands preservation Watershed approach to environmental management Subregion Analysis of Current Conditions: Upper Rio Grande
Water Quantity Increasing water demand Water Quality Nitrate level concern High salinity due to natural geologic salt deposits Invasion of the salt cedar Subregion Analysis of Current Conditions: Middle Rio Grande
Pecos River Projects Addressing the salt cedar problem City of Pecos Addressing the need for water and wastewater infrastructure Texas Water Development Board Fund water and wastewater infrastructure projects TEXAS Plan and North American Development Bank Installation of water and wastewater connections for colonias Subregion Current Plans and Programs: Middle Rio Grande
Water Quantity Low flow conditions 2005—4th driest year Concerns remain about Mexico not providing water under 1944 treaty Aquatic weeds Water Quality High bacteria levels Subregion Analysis of Current Conditions: Lower Rio Grande
Optimize supply of water from Rio Grande Reduce municipal demand through conservation Diversify water supply sources including reuse and desalination Implements conservation practices Acquire additional Rio Grande water supplies Subregion Current Plans and Programs: Lower Rio Grande
Carlos Rubinstein, Water Table Co-Chair 1804 West Jefferson Ave Harlingen, TX 78550-5247 (956) 425-6010 Contact