Download
1 / 24
240 likes | 259 Vues
This presentation will discuss the use of big data and machine learning in improving highway safety, with a focus on highway incident detection. It will explore the benefits, challenges, and future considerations of these technologies in the transportation sector.

E N D
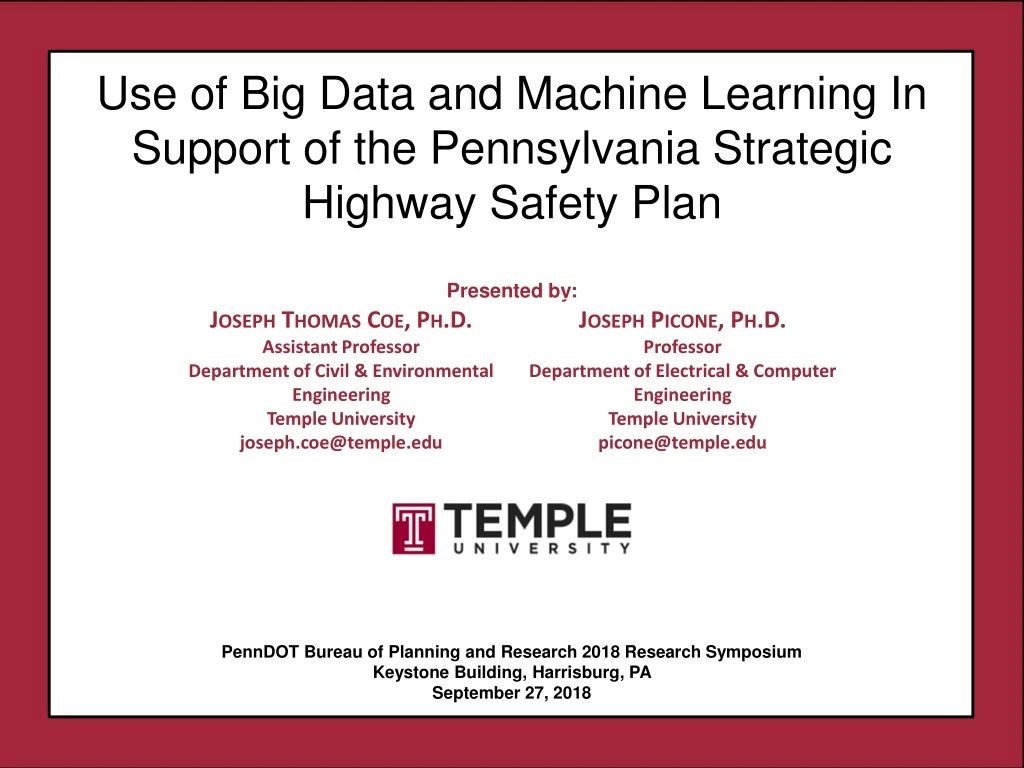
Use of Big Data and Machine Learning In Support of the Pennsylvania Strategic Highway Safety Plan Presented by: PennDOT Bureau of Planning and Research 2018 Research Symposium Keystone Building, Harrisburg, PA September 27, 2018
Organization of Presentation • Introduction and Motivation • Big Data • Machine Learning • Applications to Safety • Highway Incident Detection Timeline • Autonomous Vehicles • Conclusions & Future Considerations
Introduction Big Data Is Everywhere • Bob Mercer, IBM Speech Research (1985): “There is no data like more data.” • Dan Ariely, Duke University (2013): “Big Data is like teenage sex: everyone talks about it,nobody really knows how to do it,everyone thinks everyone else is doing it,so everyone claims they are doing it.” • Douglas Merrill, Zestfinance.com (2013): “Given enough data, everything is statistically significant.”
Introduction Why is Big Data So Important? • Deep learning systems have contributed to reductions in error rates in speech recognition from 80% in the 1990’s to 6.9% in 2016. • Progress in the last 5 years alone has been significant. Deep Learning MarkovModel • Deep learning systems require large amounts of data:
Introduction The Classic Machine Learning Paradigm Key issues: • Is the data representative of the problem? • Do the features capture meaningful differences between patterns? • How do we find the best model? • How do we estimate the parameters of the model? • How do we evaluate performance? Collect Data Evaluate Classifier Select Features Choose Model Train Classifier Other considerations: • The answers are often application specific and data dependent. • Customers/users don’t often completely understand their requirements. • Data collection is often an on-going process that drives the technology.
Introduction Big Data In Transportation Systems • Transportation systems and networks are awash in vast amounts of unstructured data: • 67 counties; 12 PennDOT districts; 120,527 linear miles of highways; 278,414,227 Daily Vehicle Miles Traveled (DVMT) • Over 25,000 bridges statewide • Traffic counts available at 30,000 sites statewide • Over 700 traffic cameras • Hundreds of thousands of 911 entries related to highway incidents statewide each year • PennDOT Road Condition Reporting System (RCRS)
Introduction Why Big Data Is Critical For Transportation Safety • Transportation safety is a multi-faceted issue involving many contributing factors: • Human, infrastructure, emergency medical services, public policy and education, technology, etc. • Decentralized databases with large amounts of complementary information • Element vs. System performance • Potential for powerful analytics to link micro- and macro-scales of interest • Development and validation of performance measures • Data-driven and evidence-based best practices • Allocation of resources
Applications to Safety Highway Incident Timeline Detection (WO TEM 009) • Motivation • PennDOT Road Condition Reporting System (RCRS) • Notification of highway incidents relative to 911 dispatch centers • Benefits: • Reduce time to clear incidents • Reduce time gap between highway closure and public notification • Provide information to aid in policies related to traffic incident management • Identify potential key elements and any critical missing information related to traffic incident management in PA • Improve operation at statewide, regional, and district traffic management centers (TMC).
Applications to Safety Highway Incident Timeline Detection (WO TEM 009) • Objectives • Determine average timeline for incident response along I-76, I-78, I-80, I-81, I-83, and I-95
Applications to Safety Highway Incident Timeline Detection (WO TEM 009) • Data Acquisition • RCRS • 20,950 entries (01/01/2013 – 11/22/2016) reduced to 8,984 37 counties reduced to 29 • Event types status reduced to “Closed”, “Lane Restriction”, “Ramp Closure”, and “Ramp Restriction” • 911 Call Centers • 1,015,743 total entries • 17 of 29 counties • Accounted for 50.8% of RCRS (88.6% excluding Philadelphia) • Issues: • Inconsistent data structure (e.g., GPS info) • Inconsistent file formats (e.g., Excel vs. Scanned Sheets) • Highway incidents dispatched by Pennsylvania State Police (PSP)
Applications to Safety Highway Incident Timeline Detection (WO TEM 009) • Data Pre-processing • Initial Manual Efforts • Identified matches between RCRS and county 911 for first 100 RCRS entries • Aided to evaluate needs for normalized data Dauphin Montgomery Cumberland
Applications to Safety Highway Incident Timeline Detection (WO TEM 009) • Data Pre-processing • Initial Manual Efforts • Identified matches between RCRS and county 911 for first 100 RCRS entries • Aided to evaluate needs for normalized data • Normalization • Algorithm developed to normalize datasets using Python programming language • Specific structure for time, location, and incident type information
Applications to Safety Highway Incident Timeline Detection (WO TEM 009) • Integrated Framework For Pairing RCRS/911 Data • Initial Manual Efforts • Identified matches between RCRS and county 911 for first 100 RCRS entries • Automated Efforts • Algorithm developed using Python programming language to utilize GPS coordinates (Susquehanna and Lackawanna counties) • Graphical User Interface (GUI) developed for remaining cases without GPS information • PyQT4 Python bindings for the Qt cross-platform GUI/XML/SQL C++ framework
Applications to Safety Highway Incident Timeline Detection (WO TEM 009) • Data Analysis & Discussion • Power law distribution • ≈ 70% of all matched records ≤ 20 minute time difference • ≈ 10% of all matched records > 1 hour
Applications to Safety Highway Incident Timeline Detection (WO TEM 009) • Data Analysis & Discussion • Overall median time difference = 12 minutes • 75% of all matched records have time difference < 28 minutes • Counties with smaller time difference had smaller IQR
Applications to Safety Highway Incident Timeline Detection (WO TEM 009) • Data Analysis & Discussion • Spatial Distribution
Applications to Safety Highway Incident Timeline Detection (WO TEM 009) • Lessons Learned & Applications to Safety • Results exhibited strong spatial differences in notification latency • Identification of which stretches of highways can be targeted for improvements • Better allocate resources to minimize time gaps for highway closures in response to emergencies • Establish baseline statistical responses and continue to use the integrated framework to evaluate the efficacy of traffic operations improvement efforts as well as to model any changes in county activities • Significant differences between various 911 centers increases difficulty of establishing links to existing RCRS records. • Increased integration of datasets can begin to address these issues and improve operational emergency management of highways in PA.
Applications to Safety Highway Incident Timeline Detection (WO TEM 009) • Lessons Learned & Applications to Safety • Improvements offered by Machine Learning & Big Data Analytics • Machine learning systems can discover latent relationships and representations (e.g., root causes) if there is ample training data and the data is consistent. • If the RCRS dataset was larger and more consistent, we could have more precisely estimated response times. • Machine learning can also extract meaning from text. • We could have also automatically normalized and formatted the data, as well as extracted more precise locations of events.
Conclusions & Future Considerations • Increased dataset integration • Necessary for improvements in highway safety • Incentivize participation in database integration • Big data analytics and machine learning to drive evidence-based best practices for highway safety • Distributed data networks across highways • Opens new research avenues • Element-level and system-level transportation performance
Conclusion Questions are welcome Thank you for your interest Presented by: PennDOT Bureau of Planning and Research 2018 Research Symposium Keystone Building, Harrisburg, PA September 27, 2018