Topic: Strategic Control
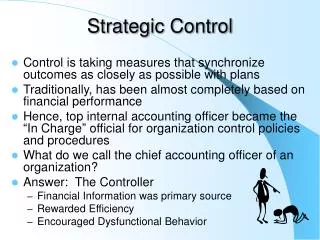
Topic: Strategic Control. Strategic Control. How do we know if it’s working?. Strategic Control. Measure (performance) Compare (to objectives) Act (to correct problems) What gets measured, gets done… What gets measured right, gets done right. Strategic Control.

Topic: Strategic Control
E N D
Presentation Transcript
Strategic Control • How do we know if it’s working?
Strategic Control • Measure (performance) • Compare (to objectives) • Act (to correct problems) • What gets measured, gets done… • What gets measured right, gets done right
Strategic Control • Is an exercise in figuring out how we define measuring things right • What’s the goal? • What’s the metric?
Strategic Control • Is an exercise in figuring out how we define measuring things right • What’s the goal? • What’s the metric? • There are some common ones
Strategic Control • KSF’s (PLF, sales ft2, occupancy rates) • Financial ratios • Liquidity • Activity • Leverage • Profitability • Simple, but useful probes • In isolation, over time, over industry
Ratios: Liquidity Current assets ------------------------ Current liabilities Current Ratio: Current assets - inventory ---------------------------------- Current liabilities Quick Ratio:
Ratios: Activity Sales ---------------- Total assets Asset turnover: Sales ---------------- Inventory Inventory turnover:
Ratios: Leverage Total liabilities ------------------- Total assets Debt ratio: Total liabilities ---------------------------- Total common equity Debt to equity: EBIT ---------------------- Interest expense Times interest earned:
Ratios: Profitability Net income ------------------- Total assets Return on assets: Net income ---------------------------- Total common equity Return on equity: Net income ---------------------- Total sales Return on sales:
Strategic Control • KSF’s • Financial ratios • Liquidity (Quick ratio) • Activity (Inventory turnover) • Leverage (D/E) • Profitability (ROE, ROS, ROA) • Simple, but useful probes. • In isolation, over time, over industry
Strategic Control • Alternative measures: • EVA (Economic Value Added) • Altman’s Z • The Balanced Scorecard (later on)
Economic Value Added (EVA) After-Tax Operating Profit - Cost of Capital = Value Created (Destroyed)
Economic Value Added (EVA) One option is just to look at profits (measure of your choice) or profits relative to size, measured as sales, equity, etc.
Economic Value Added (EVA) But that ignores the true cost of capital!
Economic Value Added (EVA) Weighted average cost of capital
Economic Value Added (EVA) Stern Stewart & Co.: http://www.sternstewart.com/ Specifically, “EVA and Strategy:” http://www.sternstewart.com/research/studies2.aspx?ID=1291
Altman’s Z • A way of measuring downside risk, rather than positive upside performance • Assesses the probability of bankruptcy within the next 12 months
Altman’s Z • Z = 1.2 X1 + 1.4 X2 + 3.3 X3 + 0.6 X4 + 1.0 X5 • X1 = WC/TA (WC = CA – CL) • X2 = RE/TA • X3 = EBIT/TA • X4 = MVE/TL (MVE = #shares * $/share) • X5 = SALES/TA
Altman’s Z • Z = 1.2 X1 + 1.4 X2 + 3.3 X3 + 0.6 X4 + 1.0 X5 • X1 = WC/TA (WC = CA – CL) • X2 = RE/TA • X3 = EBIT/TA • X4 = MVE/TL (MVE = #shares * $/share) • X5 = SALES/TA • (WC = working capital; TA = total assets; CA, CL = current assets & liabilities; RE = retained earnings; EBIT = earnings before interest & taxes; MVE = market value of equity; TL = total liabilities)
Altman’s Z • Z = 1.2 X1 + 1.4 X2 + 3.3 X3 + 0.6 X4 + 1.0 X5 • X1 = WC/TA (WC = CA – CL) • X2 = RE/TA • X3 = EBIT (yearly)/TA • X4 = MVE/TL (MVE = #shares * $/share) • X5 = SALES (yearly)/TA • Range usually -5 to 10 • -5 to 1.8, immediate danger (85% chance) • 1.8 to 3.0, gray zone • 3.0 to 10, no immediate danger
Privately Held Firms. The X4 term can be reestimated using book values of equity: Z = .717 X1 + .847 X2 + 3.107 X3 + .420 X4 + .998 X5 (< 1.23; > 2.90) Nonmanufacturing Firms. Eliminate the X5 term b/c of lower asset base of service/merchandising: Z = 6.56 X1 + 3.26 X2 + 6.72 X3 + 1.05 X4 (< 1.1 ; > 2.6)
Control: • You have to know what your quantifiable targets are for each goal (objectives) • You have to know how you will measure them • You have to have those mechanisms in place before you begin • You have to baseline
Other stuff: • “The Balanced Scorecard” will be introduced later on…