Download
1 / 35
390 likes | 854 Vues
第 十三單元 (2) : Facility Decisions Network Design in a Supply Chain. Facility Decisions Network Design in a Supply Chain. 蔣明晃教授. 【 本著作除另有註明外,採取 創用 CC 「姓名標示-非商業性-相同方式分享」台灣 3.0 版 授權釋出 】. 1. Customer Store. Materials DC. Customer DC. Finished Goods DC. Vendor DC. Customer Store.

E N D
第 十三單元(2) :Facility Decisions Network Design in a Supply Chain Facility DecisionsNetwork Design in a Supply Chain 蔣明晃教授 【本著作除另有註明外,採取創用CC「姓名標示-非商業性-相同方式分享」台灣3.0版授權釋出】 1
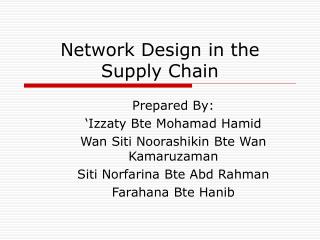
Customer Store Materials DC Customer DC Finished Goods DC Vendor DC Customer Store Component Manufacturing Vendor DC Customer DC Customer Store Plant Warehouse Components DC Customer Store Vendor DC Finished Goods DC Customer DC Final Assembly Customer Store Conventional Network Codigofonte.net Codigofonte.net Codigofonte.net 2
Network Design Decisions • Facility role and processes needed to be performed • Facility location: strategic view • Lower cost, flexibility: Toyota • Responsiveness, cost-effective: Amazon • Capacity allocation • Market and supply allocation Microsoft。 3
Factors Influencing Network Design Decisions • Strategic roles: • Off-shore facility: low-cost for export production • Source facility: low-cost facility for global production (involve manufacture through oversea) • Server facility: regional market supporting • Contributor facility: regional with development skills • Outpost facility: regional build to gain local skills • Lead facility: lead in development and process technologies Microsoft。 4
Factors Influencing Network Design Decisions • Technological: availability, cost and flexibility • examples: computer chips v.s. Coke • Macroeconomic: • tariffs and tax incentives (WTO, regional agreements, free trade zone, local content & limits) • Exchange rate and demand risk • Political: • stability; legal system • Infrastructure: • available sites, labor availability, proximity to transportation channels, local utilities Microsoft。 5
a 1-b 0 1 Factors Influencing Network Design Decisions • Competitive: • Positive externalities: company tend to locate close to each other, develop appropriate infrastructure • Locating to split the market: capture the largest market share • Customer response time and local presence Microsoft。 6
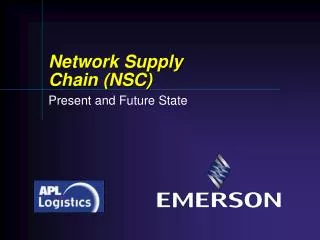
The Cost-Response Time Frontier Local FG Hi Mix Regional FG Local WIP Cost Central FG Central WIP Central Raw Material and Custom production Custom production with raw material at suppliers Low Low Hi Response Time 7
Factors Influencing Network Design Decisions • Logistics and facility costs: • Inventory costs • Transportation costs: weight or volume • Facility setup and operating costs 8
Cost Build-up as a function of facilities Total Costs Total Costs Percent Service Level Within Promised Time Percent Service Level Within Promised Time Facilities Facilities Inventory Inventory Transportation Transportation Labor Labor Number of Facilities 9
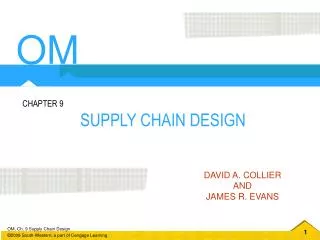
A Framework for Global Site Location GLOBAL COMPETITION Competitive STRATEGY PHASE I Supply Chain Strategy INTERNAL CONSTRAINTS Capital, growth strategy, existing network TARIFFS AND TAX INCENTIVES PRODUCTION TECHNOLOGIES Cost, Scale/Scope impact, support required, flexibility REGIONAL DEMAND Size, growth, homogeneity, local specifications PHASE II Regional Facility Configuration POLITICAL, EXCHANGE RATE AND DEMAND RISK COMPETITIVE ENVIRONMENT PHASE III Desirable Sites AVAILABLE INFRASTRUCTURE PRODUCTION METHODS Skill needs, response time FACTOR COSTS Labor, materials, site specific PHASE IV Location Choices LOGISTICS COSTS Transport, inventory, coordination 10
Local DC Cross-Dock Store 1 Regional Finished Goods DC Customer 1 DC Store 1 Local DC Cross-Dock National Finished Goods DC Store 2 Customer 2 DC Local DC Cross-Dock Store 2 Regional Finished Goods DC Store 3 Store 3 Tailored Network: Multi - Echelon Finished Goods Network Codigofonte.net 11
Information Needed for Design Decision • Location of supply sources and markets • Location of potential facility site • Demand forecasts by market • Facility, labor, and materials cost by site • Transportation costs between each pair of sites • Inventory costs by site as well as a function of quantity • Sales price of product in different regions • Taxes and tariffs as product is moved between locations • Desired response time and other service factors Microsoft。 12
Phase II: Network Optimization Models • Decide the regions where facilities to be located by considering regional demand, tariffs, economies of scale, and aggregate factor costs • Two possible alternatives: • Setup facility in each region • Consolidate plants in few regions 13
Phase II: Network Optimization Models • Decide the regions where facilities to be located by considering regional demand, tariffs, economies of scale, and aggregate factor costs • Two possible alternatives: • Setup facility in each region • Consolidate plants in few regions 14
The Capacitated Plant Location Problem • n =number of potential locations/capacity • m = number of markets • Dj = annual demand of market j • Ki = capacity of plant i • fi= annualized fixed cost of keeping factory i opened • Cij= cost of producing and shipping 1 unit from factory i to market j • yi = 1 if plant is located at site i, 0 otherwise • xij = Quantity shipped from plant site i to customer j 15
Phase III: Gravity Location Models • Identify potential locations in each region • Geographical locations: • Plainer: Gravity location models • Network: median models, center models 16
Gravity Methods for Location • Ton Mile-Center Solution • x,y: Warehouse Coordinates • xn, yn : Coordinates of delivery location n • dn : Distance to delivery location n • Fn : cost of shipping one unit for one mile • Dn : Annual tonnage to delivery location n Min 17
X= Y= Gravity Methods for Location Dn Fn Xn Dn Fn Dn Fn Yn Dn Fn 18
Gravity Methods for Location • Ton Mile-Center Solution • x,y: Warehouse Coordinates • xn, yn : Coordinates of delivery location n • dn : Distance to delivery location n • Fn : cost of shipping one unit for one mile • Dn : Annual tonnage to delivery location n Min 19
Phase IV: Network Optimization Models • Decide how market will be allocated to facilities • Must consider customer service constraints in term of response time • Decision should be altered on a regular basis as cost change and market evolve. 20
Which market is served by which plant? Which supply sources are used by a plant? Demand Allocation Model • n =number of potential locations/capacity • m = number of markets • Dj = annual demand of market j • Ki = capacity of plant i • Cij = cost of producing and shipping 1 unit from factory i to market j • xij= Quantity shipped from plant site i to customer j s.t. s.t. 21
The Capacitated Plant Location Problem • n =number of potential locations/capacity • m = number of markets • Dj = annual demand of market j • Ki = capacity of plant i • fi = annualized fixed cost of keeping factory i opened • Cij = cost of producing and shipping 1 unit from factory i to market j • yi = 1 if plant is located at site i, 0 otherwise • xij = Quantity shipped from plant site i to customer j 22
Capacitated Plant Location with Single Sourcing • yi = 1 if plant is located at site i, 0 otherwise • xij = 1 if market j is supplied from plant site i, 0 otherwise s.t. s.t. 23
Location Allocation Decisions Plants Warehouses Markets 1 2 Which plants to establish? Which warehouses to establish? How to configure the network? 24
Locate Plants and Warehouses Simultaneously • n =number of potential locations/capacity • m = number of markets or demand points • l = number of suppliers • t = number of potential warehouse locations • DJ = annual demand of market j • Ki = capacity of plant i • Sh = supply capacity at supplier h • We = potential warehouse capacity at site e • Fi = annualized fixed cost of keeping factory i opened • fe= annualized fixed cost of keeping warehouse e opened • Chi = cost of shipping 1 unit from supply source h to factory i • Cie= cost of producing and shipping 1 unit from factory i to warehouse e • Cej = cost of shipping 1 unit from warehouse e to market j 25
Locate Plants and Warehouses Simultaneously • l = number of suppliers supplier manufactory warehouse customer market plant ( l ) ( n ) ( t ) ( m ) Sh Ki We Dj • We = potential warehouse capacity at site e • m = number of markets or demand points • n =number of potential locations/capacity • t = number of potential warehouse locations • DJ = annual demand of market j • Ki = capacity of plant i • Sh = supply capacity at supplier h 26
Locate Plants and Warehouses Simultaneously • Fi = annualized fixed cost of keeping factory i opened supplier manufactory warehouse customer market plant ( l ) ( n ) ( t ) ( m ) Chi Cie Cej Sh Ki We Dj Fi fe • fe= annualized fixed cost of keeping warehouse e opened • Chi = cost of shipping 1 unit from supply source h to factory i • Cie= cost of producing and shipping 1 unit from factory i to warehouse e • Cej = cost of shipping 1 unit from warehouse e to market j 27
Locate Plants and Warehouses Simultaneously • yi = 1 if factory is located at side i • ye = 1 if warehouse is located at side e • xej= quantity shipped from warehouse e to market j per year • xie = quantity shipped from factory i to warehouse e per year • xhi = quantity shipped from supplier h to factory i per year 28
Locate Plants and Warehouses Simultaneously • yi = 1 if factory is located at side i • ye = 1 if warehouse is located at side e • xej= quantity shipped from warehouse e to market j per year • xie = quantity shipped from factory i to warehouse e per year • xhi = quantity shipped from supplier h to factory i per year supplier manufactory warehouse customer plant market ( l ) ( n ) ( t ) ( m ) yi ye xhj xie xej Chi Cie Cej Sh Ki We Dj Fi fe 29
supplier manufactory warehouse customer plant market ( l ) ( n ) ( t ) ( m ) yi ye xhj xie xej Chi Cie Cej Sh Ki We Dj Fi fe Locate Plants and Warehouses Simultaneously 30
Accounting for Taxes, Tariffs, and Customer Requirements • If rjis the revenue form selling one unit in market j, the objective function of the capacitated plant location model can be modified as • Also the constraint related to demand is modified as • Customer preferences and requirements can be modeled in terms of modes of transportation. 32
Making Network Design Decisions in Practice • Do not underestimate the life span of facilities • Do not gloss over the cultural implications • Do not ignore quality of life issues • Focus on tariffs and tax incentives when locating facilities Microsoft。 33
版權聲明 34
版權聲明 35