Download
1 / 2
20 likes | 159 Vues
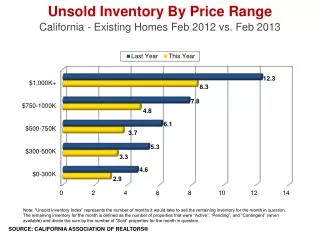
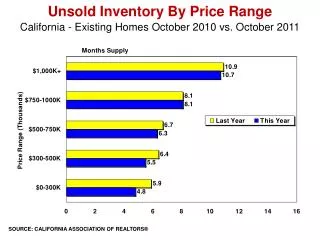
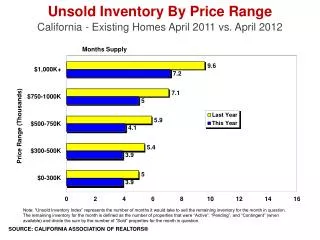
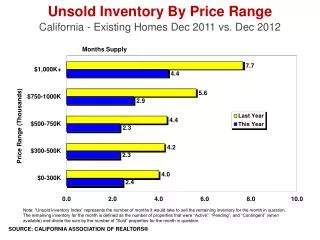
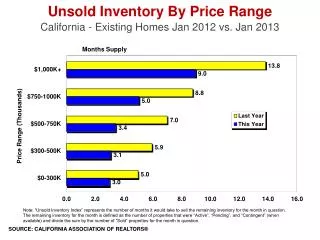
This report examines the unsold inventory of existing homes in California for January 2012 compared to January 2013. The Unsold Inventory Index, which reflects the months required to sell the current inventory, is calculated by dividing the total number of "Active," "Pending," and "Contingent" properties by the number of homes sold in the respective month. Insights from this analysis, sourced from the California Association of Realtors®, provide a clear view of the market's changing dynamics over the specified periods.

E N D
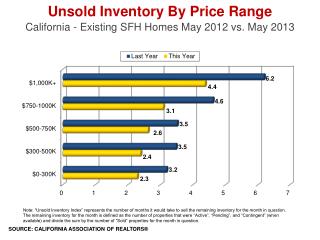
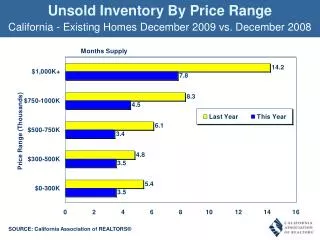
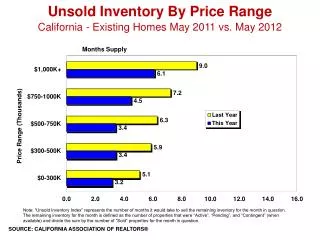
Unsold Inventory By Price Range • California - Existing Homes Jan 2012 vs. Jan 2013 Note: “Unsold Inventory Index” represents the number of months it would take to sell the remaining inventory for the month in question. The remaining inventory for the month is defined as the number of properties that were “Active”, “Pending”, and “Contingent” (when available) and divide the sum by the number of “Sold” properties for the month in question. SOURCE: CALIFORNIA ASSOCIATION OF REALTORS®
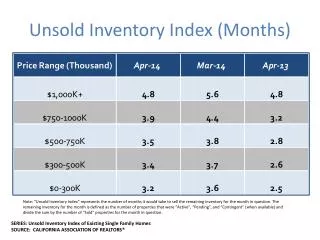
Unsold Inventory Index (Months) Note: “Unsold Inventory Index” represents the number of months it would take to sell the remaining inventory for the month in question. The remaining inventory for the month is defined as the number of properties that were “Active”, “Pending”, and “Contingent” (when available) and divide the sum by the number of “Sold” properties for the month in question. SOURCE: CALIFORNIA ASSOCIATION OF REALTORS®