Unsold Inventory Trends in California Real Estate: May 2011 vs. May 2012
20 likes | 153 Vues
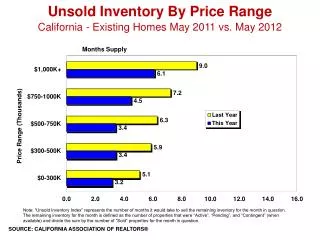
This report compares the unsold inventory of existing homes in California for May 2011 and May 2012, focusing on the Unsold Inventory Index. This index indicates the number of months required to sell the remaining properties listed as active, pending, or contingent at the end of each month, divided by the number of sold properties for that month. Insights from this analysis provide a critical understanding of market trends and inventory levels in California’s real estate landscape.

Unsold Inventory Trends in California Real Estate: May 2011 vs. May 2012
E N D
Presentation Transcript
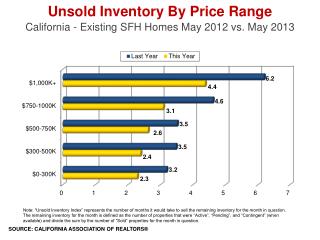
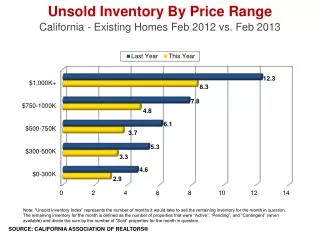
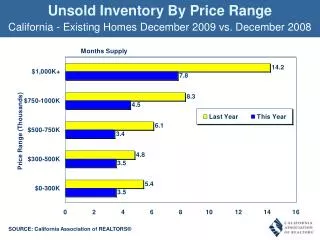
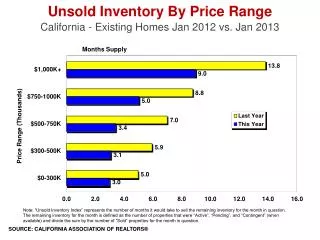
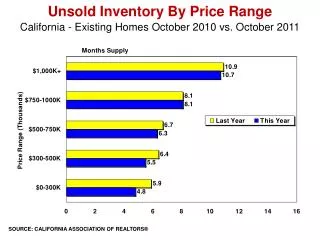
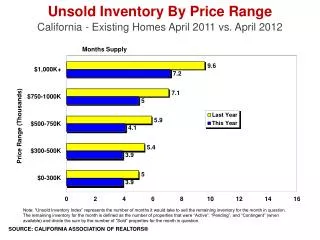
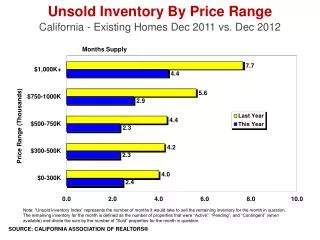
Unsold Inventory By Price Range California - Existing Homes May 2011 vs. May 2012 Note: “Unsold Inventory Index” represents the number of months it would take to sell the remaining inventory for the month in question. The remaining inventory for the month is defined as the number of properties that were “Active”, “Pending”, and “Contingent” (when available) and divide the sum by the number of “Sold” properties for the month in question. SOURCE: CALIFORNIA ASSOCIATION OF REALTORS®
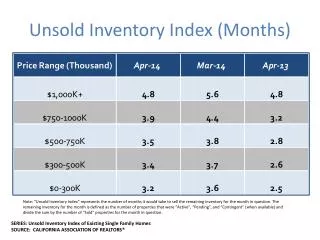
Unsold Inventory Index (Months) Note: “Unsold Inventory Index” represents the number of months it would take to sell the remaining inventory for the month in question. The remaining inventory for the month is defined as the number of properties that were “Active”, “Pending”, and “Contingent” (when available) and divide the sum by the number of “Sold” properties for the month in question. SOURCE: CALIFORNIA ASSOCIATION OF REALTORS®