Data Analysis Workshop: Identifying Progress Rates and Closing Attainment Gaps
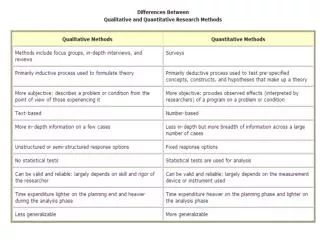
Explore data analyses available in RAISEonline to identify progression rate disparities and set ambitious targets using pupil estimates from FFT Live data. Learn to analyze VA reports, CVA analyses, and dynamic reports to pinpoint areas of improvement for different student groups.


Data Analysis Workshop: Identifying Progress Rates and Closing Attainment Gaps
E N D
Presentation Transcript
Workshop 3P (Primary) Analysing progress data
Objectives To explore the data analyses that are available in RAISEonline and how they can be used to identify differences in progression rates To consider the use of pupil estimates, available through FFT Live data, to set challenging targets aimed at narrowing attainment gaps
Resource 3.1P: KS1–2 VA, expected vs actual scatterplot – gender 2
Some key points to note Three boys but no girls have made progress that is in line with the top 10% of children nationally. One boy and one girl have made progress that is in line with the bottom 10% of children nationally.
Resource 3.2P: KS1–2 VA, expected vs actual scatterplot (science) – SEN 4
Some key points to note Eight children are identified on the SEN register as requiring school action. Six of these children have expected KS2 scores of 25 points or below (L4c or below). Only one of these children is making significantly less progress than might be expected, having an expected score of 25.5 and an actual score of 22.5. This indicates that the child is about a year behind the expected score in science (half a National Curriculum level).
Key questions about VA reports (1) How many children lie above the 10th percentile line, or below the 90th percentile line? Is either of these groups dominated by a particular group of children (e.g. boys, girls, FSM children, children from minority ethnic groups)? Is there a difference in the pattern of progress in core subjects for lower-attaining children (expected score below 21 (L3b) at KS2) and that of their peers?
Key questions about VA reports (2) Is there a difference in the pattern of progress in core subjects for higher-attaining children (expected score above 27 (L4b) at KS2) and that of their peers? Does school analysis make effective use of the ‘Subject’ and ‘Group’ menus when analysing progress?
Resource 3.3P: KS1–2 CVA analysis, expected vs actual scatterplot (English) – boys 8
Some key points to note Boys are making good progress in English. Only one boy is below the 75th percentile line. His expected KS2 score was 20 points and he actually scored 17 points. The difference of 3 points is half a National Curriculum level, equivalent to about a year’s progress. The boy with the lowest expected score made exceptionally good progress, scoring 25 points (equivalent to L4c).
Resource 3.4P: KS1–2 CVA analysis, expected vs actual scatterplot (mathematics) – FSM
Some key points to note FSM children all make progress that is in line with, or better than, expectations. The progress of higher-attaining children is variable (those with expected KS2 score of at least 31 points (L5c). Three of these children are located between the 75th and 90th percentiles, while five are located above the 25th percentile.
Resource 3.5P: KS1–2 CVA dynamic report (mathematics) – gender, FSM and SEN
Some key points to note Two groups have CVA scores below 100. These are not identified as significant (sig) – because the confidence intervals are large because of the small group sizes. Both these groups refer to children entitled to FSM. One child (a boy) has a statement of SEN. He is not entitled to FSM, and has a CVA score of 101.1 for mathematics.
Key questions about CVA reports (1) Are groups that have underperformed historically making enough progress to narrow attainment gaps? How can these groups, especially FSM children, be supported further to ensure that they achieve key threshold indicators? How many children lie above the 10th percentile line, or below the 90th percentile line? Is either of these groups dominated by a particular group of children (e.g. boys, girls, FSM children, children from minority ethnic groups)?
Key questions about CVA reports (2) Is there a difference in the pattern of progress in core subjects for lower-attaining children (expected score below 21 (L3b) at KS2) and that of their peers? Is there a difference in the pattern of progress in core subjects for higher-attaining children (expected score above 27 (L4b) at KS2) and that of their peers? Does school analysis make effective use of the ‘Subject’ and ‘Group’ menus when analysing progress?
A key point to note The success rate for all three groups of children is below the predicted rate, but significantly so for children with a lower probability of meeting the threshold.
Some key points to note All seven children who achieved L3 at KS1 made fewer than two levels of progress in KS2. 64% of the children who achieved below L4 at KS2 were boys. 57% of the children who achieved below L4 at KS2 were entitled to FSM.
Resource 3.8P: KS1–2 pupil progress chart (English) – high attainers, girls
A key point to note Seven girls achieved L3 at KS1. Three of them made expected progress to L5 at KS2, while four made only one level of progress during KS2.
Key questions about conversion charts (1) Which groups of children in the school are stuck? (That is, they made no measurable progress during a key stage.) Which groups of children make slow progress? Which groups of children make expected or better progress, but still fail to reach important threshold measures?
Key questions about conversion charts (2) Does the school tracking system accurately identify children who are falling behind in the early years of a key stage? Does the school tracking system identify children who are falling behind in one or other of the core subjects? How rigorously is the impact of interventions designed to raise attainment in core subjects evaluated?
Some key points to note The green highlight shows the levels achieved by children within the top 5%, 10%, 15%, 20% or 25% (user option). In this example, the 25% option is selected. The orange highlight shows the level with the highest probability of being achieved by the child. Katrina Aluminium has almost as high an estimated probability of achieving L3 as L2 but one in 20 similar children historically have attained L4.
Key questions about FFT pupil estimate reports Is the school’s use of pupil estimates based on a thorough understanding of the difference between estimates and targets? How is information about individual children’s expertise and interest in a subject taken into account when using FFT estimates (that are based on prior attainment in core subjects)? How is additional challenge incorporated in individual children’s targets to ensure that attainment gaps are narrowed for groups that have underperformed historically?