Exploring Experimental Methods in Scientific Investigations
This project document outlines a detailed approach to conducting scientific experiments. It includes specific aims and predictions that initiate the investigation with terms such as "To find out," and even features hypotheses formulated with reasoning. The methodology section employs imperative verbs and organized steps for safety and clarity. The document extensively lists the variables, drawing diagrams and using appropriate equipment with scientific nomenclature. It provides a structured results table and graphical representations for clarity, accompanied by analyses and evaluations of findings, promoting a thorough understanding of experimental science.


Exploring Experimental Methods in Scientific Investigations
E N D
Presentation Transcript
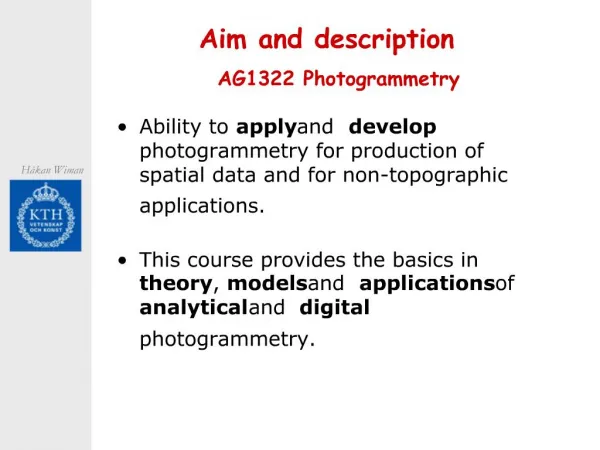
Aim and prediction I have • Written an aim which starts with: • Tofindout.. • Toinvestigate… • Todiscover… • Written a predictionthatincludesthewordbecause. E.g. I thinkthat… because….
Method I have • Written in the imperative • Usedbulletpointsornumbersforthesteps • Mentionedhowtobesafe Goodmethodverbs: Take, put, measure, pour, add, heat, weigh…
Variables I have written all three variables: • Independent (what I change) • Dependent (what I measure) • Control (how I willmaketheexperimentfair) • I haveincluded at leasttwo control variables
Diagram I have • Used a ruler • Used pencil • Labeled the equipment with a straight line • Drawn everything in 2D • Drawn the diagram in at least half a page of my notebook
Equipment I have • Listed all the equipment I have used • Used scientific names of the equipment • Said WHY I chose each piece of equipment
Results table I have • Put the independent variable in the left column • Putthedependent variable in therightcolumn • Repeatedtheexperiment • Takenaverages • Putunits at the top of thecolumn • Used a ruler
Bar chart I have • Used mm graph paper • Put the independent variable on the x axis and the dependent variable on the y axis • Written a title • Underlined the title with a ruler • Drawn the axes with a ruler • Labeled the axes • Labeled the y axis with units • Used a regular increase on the y axis (e.g. 2,4,6 NOT 1,3,4,7) • Drawn all the bars the same width
Line graph I have • Used mm graph paper • Written a title • Underlined the title with a ruler • Drawn the axes with a ruler • Put the independent variable on the x axis and the dependent variable on the y axis • Labeled the axes • Labeled the axes with units • Used a regular increase on the axes (e.g. 2,4,6 NOT 1,3,4,7) • Used crosses for the data points • Drawn a line of best fit (curved or straight)
Conclusion I have • Described what I have found out • Explainedwhat i foundout • Describedifthereis a patterne.g. if … increasesthen … decreases • Usedscientificvocabulary • Writtenifthere are anystrange (anomylous) results
Evaluation I have • Tried to explain any anomalous results (why did they happen? • Said whatisgoodabout my method • Said how I can improve my method • Writtenaboutanyotherexperiments I could do in thefuturetoinvestigate more • Writtenaboutworking in a team