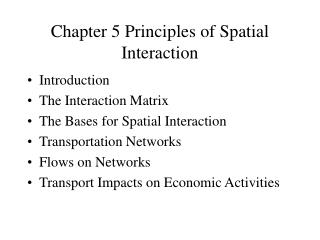
Chapter 5 Principles of Spatial Interaction
Chapter 5 Principles of Spatial Interaction. Introduction The Interaction Matrix The Bases for Spatial Interaction Transportation Networks Flows on Networks Transport Impacts on Economic Activities. The Interaction Matrix. Direction of flow?. Connectivity Matrix Measures of connectivity

Chapter 5 Principles of Spatial Interaction
E N D
Presentation Transcript
Chapter 5 Principles of Spatial Interaction • Introduction • The Interaction Matrix • The Bases for Spatial Interaction • Transportation Networks • Flows on Networks • Transport Impacts on Economic Activities
The Interaction Matrix Direction of flow? Connectivity Matrix Measures of connectivity Ratio: actual/potential links In this example: 10 links of 20 potential: Ratio = .5 O B O D O A O C O E
Flow Matrices • Example Fig. 5.2 (p. 78) • Also our i/o table • Why are patterns of flow organized as they are around: • Flows originating at particular places • Flows terminating at particular places • The routing structure used to move from origin to destination
The Bases of Spatial Interaction • Ullman’s three-part framework: • Complementarity (place utility; alternative scales in Figure 5.3) • Transferability (cost re: distance) • Intervening Opportunities (competing sources of supplies) • Ullman’s Research on railroad flows, passenger flows, for data in the 1950’s, and railroad flows for 1929.
Wheeler & Mitchelson’s Research on Information Flows • P. 82. (1) Information genesis, (2) hierarchy of control, and (3) distance independence • Information genesis – determined by center corporate control points, not by a market that demands the information • Hierarchy of control – size mediates volume • Distance has little impact the volume of information flow • Used to explain realignment of U.S. urban hierarchy
City Systems and Relations With Surrounding Territory • Functional areas versus uniform regions: the umland concept • Figure 5.4 – distance decay in interaction • Spreading of commuter fields: Figure 5.6 • The formalization of this concept by the BEA – The system of BEA Economic Areas (The dead idea of the Concorde on page 83: Illustrates how forecasts of technology are risky)
Transport Networks • Influence of physical and political geography on their configuration
Another Boundary Impact on Transport Networks See also Figure 5.8 in text
Taafee/Morrill/Gould Model of Transport Development • Figure 5.9 in text • A development sequence similar to the Vance model • Weak initial linkages • Penetration of remote territory • Development of more complex transport routes • Development of highly interconnected systems
The Location of Transport Routes & Networks From the isotropic plain to “real” landscapes: water bodies & river corridors, hills, mountains, swamps, oceans & the poles Seattle - impact of glaciation: water, hills The underlying principle of complementarity Cost components: fixed & variable Configuration into networks
The Location of Transport Routes & Networks From the isotropic plain to “real” landscapes: water bodies & river corridors, hills, mountains, swamps, oceans & the poles Seattle - impact of glaciation: water, hills The underlying principle of complementarity Cost components: fixed & variable Configuration into networks
Network Options Hybrid Least Cost to Use Least Cost to Build B A A A B B D C D C D C High Travel Costs AC, BD Maximum Connectivity Benefit-Cost Evaluation of Network Choice: - Benefits: relative travel cost (savings), interaction - Costs: investment, operations
Evaluating Networks for Maximum Net Benefits 5 4 Cost = 10 Revenue = 15 Net Benefit = 5 Cost = 12, R = 18 Net Benefit = 6 Cost = 14, R = 25 Net Benefit 11 Cost = 19, R = 29 Net Benefit = 10 10 (a) 3 7 (b) (c) (d)
Impact of Multiple Transport Modes on Routes Land Costs: Land = $2/ton-mile Sea = $1/ton mile XAY = 10*$1+10*$2 = $30 XCY = 15*$1+6*$2 = $27 XBY = 12*$1 +7*$2 = $26 X 15 Water 10 12 A B C Land 7 6 10 Y
Other Impacts on Network Structure Construction costs of given mode in different types of environments Impact of borders - political boundaries - Impact of politics (transcontinental RR; current battle over RTA line) Impact of technology - mail flows; telephone calls (flat long distance rates), the WEB, “The End of Geography?”
Factors Influencing Transport Rates 1. Grouping freight rates into zones 2. Variations due to commodity characteristics (a) Differences in cost of service related to: (1) Loading characteristics (2) Size of shipment (3) Perishability and risk of damage (b) Elasticity of Demand for Transportation 3. Variations due to traffic characteristics (a) intermodal competition (b) traffic density (c) direction of haul pp. 91-96
The Gravity Model: “Social Physics” Iij = k * PiPj Dijb where I is interaction between place i and j, p(i) and p(j) are populations of places I and j, k is an empirically derived constant, and D(i,j) is the distance between i and j, raised to an empirically derived constant, b. Stewart, Ravenstein, Ullman
Transport Impact on Development • Punt here, to take up this topic later (Janelle) • Key point: transport (and communications) improvements have reshaped the geography of production • Janelle’s argument • The long-run reduction in the cost of the friction of space