Graphing Systems of Inequalities: Finding Vertices and Extreme Values
This exercise focuses on graphing a system of inequalities to identify the feasible region. Using the inequalities (y > -4x) and (y < 3x - 4), participants will graph these lines to visualize the constraints. The task involves finding the coordinates of the vertices of the feasible region and determining the maximum and minimum values of the given function (f(x, y) = x - y) within that region. The analysis not only enhances understanding of linear programming but also provides practical skills in optimizing functions.

Graphing Systems of Inequalities: Finding Vertices and Extreme Values
E N D
Presentation Transcript
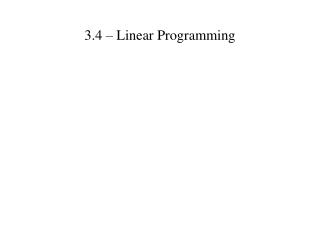
3.4 – Linear Programming Ex. 1 Graph the system of inequalities. Name the coordinates of the vertices of the feasible region. Find the max & min values of the given function for this region. y> -4 x< 3 y< 3x – 4 f(x,y) = x – y
3.4 – Linear Programming Ex. 1 Graph the system of inequalities. Name the coordinates of the vertices of the feasible region. Find the max & min values of the given function for this region. y> -4 x< 3 y< 3x – 4 f(x,y) = x – y
3.4 – Linear Programming Ex. 1 Graph the system of inequalities. Name the coordinates of the vertices of the feasible region. Find the max & min values of the given function for this region. y> -4 x< 3 y< 3x – 4 f(x,y) = x – y
3.4 – Linear Programming Ex. 1 Graph the system of inequalities. Name the coordinates of the vertices of the feasible region. Find the max & min values of the given function for this region. y> -4 x< 3 y< 3x – 4 f(x,y) = x – y
3.4 – Linear Programming Ex. 1 Graph the system of inequalities. Name the coordinates of the vertices of the feasible region. Find the max & min values of the given function for this region. y> -4 x< 3 y< 3x – 4 f(x,y) = x – y
3.4 – Linear Programming Ex. 1 Graph the system of inequalities. Name the coordinates of the vertices of the feasible region. Find the max & min values of the given function for this region. y> -4 x< 3 y< 3x – 4 f(x,y) = x – y
3.4 – Linear Programming Ex. 1 Graph the system of inequalities. Name the coordinates of the vertices of the feasible region. Find the max & min values of the given function for this region. y> -4 x< 3 y< 3x – 4 f(x,y) = x – y
3.4 – Linear Programming Ex. 1 Graph the system of inequalities. Name the coordinates of the vertices of the feasible region. Find the max & min values of the given function for this region. y> -4 x< 3 y< 3x – 4 f(x,y) = x – y
3.4 – Linear Programming Ex. 1 Graph the system of inequalities. Name the coordinates of the vertices of the feasible region. Find the max & min values of the given function for this region. y> -4 x< 3 y< 3x – 4 f(x,y) = x – y
3.4 – Linear Programming Ex. 1 Graph the system of inequalities. Name the coordinates of the vertices of the feasible region. Find the max & min values of the given function for this region. y> -4 x< 3 y< 3x – 4 f(x,y) = x – y
3.4 – Linear Programming Ex. 1 Graph the system of inequalities. Name the coordinates of the vertices of the feasible region. Find the max & min values of the given function for this region. y> -4 x< 3 y< 3x – 4 f(x,y) = x – y
3.4 – Linear Programming Ex. 1 Graph the system of inequalities. Name the coordinates of the vertices of the feasible region. Find the max & min values of the given function for this region. y> -4 x< 3 y< 3x – 4 f(x,y) = x – y
3.4 – Linear Programming Ex. 1 Graph the system of inequalities. Name the coordinates of the vertices of the feasible region. Find the max & min values of the given function for this region. y> -4 x< 3 y< 3x – 4 f(x,y) = x – y
3.4 – Linear Programming Ex. 1 Graph the system of inequalities. Name the coordinates of the vertices of the feasible region. Find the max & min values of the given function for this region. y> -4 x< 3 y< 3x – 4 f(x,y) = x – y
3.4 – Linear Programming Ex. 1 Graph the system of inequalities. Name the coordinates of the vertices of the feasible region. Find the max & min values of the given function for this region. y> -4 x< 3 y< 3x – 4 f(x,y) = x – y
3.4 – Linear Programming Ex. 1 Graph the system of inequalities. Name the coordinates of the vertices of the feasible region. Find the max & min values of the given function for this region. y> -4 x< 3 y< 3x – 4 f(x,y) = x – y
3.4 – Linear Programming Ex. 1 Graph the system of inequalities. Name the coordinates of the vertices of the feasible region. Find the max & min values of the given function for this region. y> -4 x< 3 y< 3x – 4 f(x,y) = x – y
3.4 – Linear Programming Ex. 1 Graph the system of inequalities. Name the coordinates of the vertices of the feasible region. Find the max & min values of the given function for this region. y> -4 x< 3 y< 3x – 4 f(x,y) = x – y Max of 7 @ (3,-4)
3.4 – Linear Programming Ex. 1 Graph the system of inequalities. Name the coordinates of the vertices of the feasible region. Find the max & min values of the given function for this region. y> -4 x< 3 y< 3x – 4 f(x,y) = x – y Max of 7 @ (3,-4)
3.4 – Linear Programming Ex. 1 Graph the system of inequalities. Name the coordinates of the vertices of the feasible region. Find the max & min values of the given function for this region. y> -4 x< 3 y< 3x – 4 f(x,y) = x – y Max of 7 @ (3,-4) Min of -2 @ (3,5)