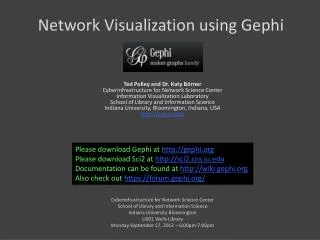
Collaborative Network Analysis in the Humanities Classroom: Using Gephi with Imagination
80 likes | 231 Vues
Collaborative Network Analysis in the Humanities Classroom: Using Gephi with Imagination. David D. Kim Michigan State University ddkim@msu.edu April 18, 2014. What is Social Network Analysis (SNA)?. The analysis of relational patterns with big data

Collaborative Network Analysis in the Humanities Classroom: Using Gephi with Imagination
E N D
Presentation Transcript
Collaborative Network Analysisin the Humanities Classroom:Using Gephi with Imagination David D. Kim Michigan State University ddkim@msu.edu April 18, 2014
What is Social Network Analysis (SNA)? • The analysis of relational patterns with big data • Actors as nodes: humans, organizations, etc. • Relations as edges: distance, strength, frequency, connectivity, density • Benefits: “The resulting graph makes possible visual inspection of relations beyond anything possible by observing the actual relations, and a graph can be a great deal more complete and less ambiguous than the ephemeral encounters on which it is based.” [JeroenBruggeman, Social Networks: An Introduction (London: Routledge, 2008), 7.]
Your Social Networks on Facebook • Log into your FACEBOOK account. • In the SEARCH box, type “netvizz”. • You have five options, but select “personal network” (first option). • Select “friend’s like and post count” and click “start”. • Right click “Your gdf file” (gdf = Geographic Data Files) and save the linkon your desktop. • Open Gephi. • Select “New Project,” go to “File,” select “Open,” and choose the saved gdf file from your desktop. • Select “OK” in the import report. • Use “ForceAtlas 2” to visualize your social network.
What do we learn from visualizing and manipulating these social connections? • See clusters of friends • Identify key players in each cluster • Use big data to analyze specific categories (sex, age, locale, etc.)
Ernest Hemingway, Hills Like White Elephants (1927) • Question 1: What is the main theme of this short story? • Question 2: What do you want students to understand in their interpretation of this short story? • Question 3: How would you teach this text in one of your courses?
Collecting Data in Interpretation Nodes (words and concepts) Edges (interpretive connections) Open a second Excel sheet with your partner for collaboration. (Later you may also use Google Drive.) Create interpretive connections between words and concepts. List the ID’s under “Source” and/or “Target” and designate “Weight” in accordance with your interpretation. Save the file as “.csv” file (comma-separated value) on your desktop. • Open an Excel sheet with your partner for collaboration. (Later you may also use Google Drive.) • List your words and concepts under “ID”. • Save the file as “.csv” file (comma-separated value) on your desktop.
Upload Data on Gephi • Select “New Project”. • Select “Data Laboratory”. • Select “Import Spreadsheet”. • Begin with nodes: • Choose the csv file for nodes from the desktop. • Select “Nodes table” under “As table” • Select “Next” and “Finish”. • Do the same with edges and make sure to select “Edges table”. • Select “Overview”. • Manipulate your interpretive network.