Download
1 / 1
10 likes | 144 Vues
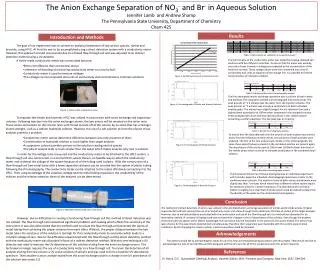
The Anion Exchange Separation of NO 3 - and Br - in Aqueous Solution Jennifer Lamb and Andrew Shamp The Pennsylvania State University, Department of Chemistry Chem 425. Results. Introduction and Methods.

E N D
The Anion Exchange Separation of NO3- and Br- in Aqueous Solution Jennifer Lamb and Andrew Shamp The Pennsylvania State University, Department of Chemistry Chem 425 Results Introduction and Methods • The goal of our experiment was to achieve an analytical separation of two anionic species, nitrate and bromide, using HPLC. At first this was to be accomplished using a direct detection system with a conductivity meter. However, this approach proved unsuccessful due to a flawed flow-through cell and was adjusted to an indirect detection method using a UV detector. • A home-made conductivity meter was constructed because: • More cost effective than commercial device • Intentions of donating a functioning conductivity meter to a local school • Conductivity meter is used to measure voltages • The voltages can be converted into units of conductivity and concentrations of known solutions • Figure 1: Home-made conductivity meter • To separate the nitrate and bromide, HPLC was utilized in conjunction with anion exchange and suppressor columns. Following injection into the anion exchange column, the two anions will be retained on the anion resin. These anions will remain on the column resin until forced to elute off of the column by an anion that has a stronger eluent strength, such as a sodium hydroxide solution. However, the use of a salt solution to force the elution of our analytes presents a problem: • Conductivity meter cannot determine difference between ions only presence of them • Concentration of hydroxide solution is much higher than target analytes • A suppressor column provides protons to the solution creating neutral species • The pKa of analyte acids is much smaller than the water which makes analytes only ions in solution • In order for the voltage to be measured and the conductivity meter to be attached to the HPLC system, a flow-through cell was constructed. In a normal HPLC system there is no feasible way to attach the conductivity meter and to detect the voltage of the system because all of the tubing used is plastic. With the construction of a flow-through cell two metal tubes with a know separation distance can be inserted into the system of plastic tubing following the chromatography. The conductivity meter can be attached to the metal, effectively connecting it to the HPLC. Then using knowledge of the solutions voltage and the metal tubing separation, the conductivity of the solution and the relative retention times of the analytes can be determined. • Figure 2: Attempted flow-through cell construction • However, due to difficulties in creating a functioning flow-through cell this method of direct detection was not utilized. The flow-through cell created had significant problems with leaking which effects the sensitivity of the instrument. It was also determined that the method used to create the flow-through cell prevented the pieces of metal tubing from achieving the proper distance from each other. Without, the proper distance between the two metal tubes the resistance of the solution is too high for this conductivity meter to overcome which leads to a constant voltage of zero. Due to the difficulties experienced with the flow-through cell the direct detection method with the conductivity meter was discarded in favor of a indirect detection method. With this new technique a UV detector was used to measure the UV absorbance of the solution eluting from the anion exchange column. This technique no longer requires the use of a conductivity meter or a flow-through cell. To ensure the detection of all analytes eluting from the column a UV active solution of salicylic acid was used to form a baseline UV absorbance spectrum. Then anytime a anion analyte eluted from the anion exchange column a change in the UV absorbance of the solution was noted. (1) Table 1: Data analysis for suitability of conductivity meter The functionality of the conductivity meter was tested by creating standard salt solutions with five different molarities. To ensure that the meter was working correctly a linear increase in voltage was expected as the concentration of the solutions increase. These voltage values were then converted into units of conductivity and, with an equation of the voltage line, it is possible to find the concentrations of unknown solutions. Figure 3: Suitability testing of conductivity meter Table 2: Nitrate and Bromide chromatography analysis The first attempted anionic exchange separation was a solution of both nitrate and bromide. This separation yielded a chromatograph with three peaks. The peak present at ~1.5 minutes was the water from the injection solution. The peak present at ~7 minutes was actually a combination of both individual analyte peaks. The nitrate had a slightly longer(.4 min.) retention time and a slightly lower absorbance at 330nm when compared to the standard solution. These analytes both elute at almost identical times in this solvent system preventing a useful separation. The last peak was an impurity. Figure 4: Chromatograph of Nitrate and Bromide Solution Table 3: Nitrate chromatography analysis To ensure that the data obtained from the solution of both analytes was correct and to find the individual retention times, test solutions of both analytes were analyzed. The first of the two analytes was nitrate. In this chromatograph, the same three peaks that were present in the combined solution are present again. The absorbance of the nitrate peak at 330nm was 1650mAu lower than that of the mobile phase which is similar to the peak absorbance in the combined anion solution. Figure 5: Chromatograph of Nitrate Solution Table 4: Bromide chromatography analysis The final experimental run that was attempted was an individual experiment with bromide. Again the individual chromatograph looked very similar to the combined anion solution. The retention times of both nitrate and bromide were slightly less than 7 minutes which means that a different solvent system would be needed to allow for a better separation. The absorbance of bromide at 330nm is slightly more than that of nitrate which could be utilized to determine the identity of the peaks on the combined chromatographs. Figure 6: Chromatograph of Bromide Solution Conclusion The method of indirect detection of anions was utilized in the attempted anion exchange separation of nitrate and bromide anions. Original experimental methods required the use of a conductivity meter and a flow-through cell to determine the time of elution of the target analytes. However, due to multiple problems associated with the construction and use of the flow-through cell, this method was discarded for an alternative method. A constant UV background was monitored for changes in the UV absorbance of the solution. Even though the analytes themselves did not absorb at the 330nm wavelength, their presence was still noticeable in the spectra as the anions eluted. The anions that were chosen for the experiment eluted almost simultaneously therefore their separation was impossible with the current experimental conditions. By the changing the solvent system, a better separation could be obtained. Acknowledgements The authors would like to acknowledge Dr. Sykes for all of his help and troubleshooting assistance with this project. They would also like to acknowledge the help of Jens Breffke and RitoSengupta and the 425 class for all of the cooperative work this project required. References (1) Harris, D.C. Quantitative Chemical Analysis, Seventh Edition; W.H. Freeman and Company: New York, 2007, 594-599.