Developing Biodiversity Indicators
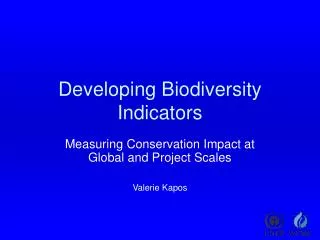
Developing Biodiversity Indicators. Measuring Conservation Impact at Global and Project Scales Valerie Kapos. Unprecedented change: Terrestrial Ecosystems. 5-10% area of five biomes converted between 1950 & 1990

Developing Biodiversity Indicators
E N D
Presentation Transcript
Developing Biodiversity Indicators Measuring Conservation Impact at Global and Project Scales Valerie Kapos
Unprecedented change: Terrestrial Ecosystems • 5-10% area of five biomes converted between 1950 & 1990 • >2/3 of the area of two biomes, & >1/2 of the area of four others converted by 1990 • Conversion of further >20% of potential area of tropical and sub-tropical moist forests projected by 2050. Millennium Ecosystem Assessment 2005
Global starting points… • Convention on Biological Diversity – • 1992, • now 188 governments • Millennium Development Goals • CBD Strategic Plan, adopted by the Conference of Parties at its sixth meeting • Hague Ministerial Declaration, adopted by Ministers responsible for CBD implementation • Plan of Implementation adopted by the World Summit on Sustainable Development
How are we doing? • Process-based indicators • Biodiversity indicators • Outcome-oriented programmes of work
Performance can be monitored at several levels: • Input - have you spent the money? • Activity - what did you do with it? • Output - what did it get you? How good was it? • Outcome- what effect has it had on the problem (cf. what would have happened without it?) • Impact - what is happening to the ecosystems/habitats/species/populations
Common issues and concerns • Clearly stated biodiversity objectives often lacking • Assumptions rarely explicitly stated • More biodiversity objectives increases monitoring burden. • Long time frames – outside normal project cycles • Many impacts unanticipated • ‘Control’ data useful but costly
2010 Target “ . . .achieve a significant reduction in of the current rate of biodiversity loss at global, national and regional levels as a contribution to poverty alleviation and to the benefit of all life on earth.”
CBD indicatorframework Framework for targets and indicators: • biodiversity components • sustainable use • threats to biodiversity • ecosystem integrity, good and services • traditional knowledge, innovations, practices • access and benefit sharing • resource transfers, both ODA and technology
Proposed global indicators Status and trends of components, e.g.: • extent of selected habitats • abundance and distribution of species • change in status of threatened species • trends in genetic diversity of domesticated species • coverage of protected areas
Locations undergoing high rates of land cover change in the past few decades
Biodiversity: Living Planet Index Tropical and Temperate Forest Species Trends over time in an average species population in each of the forest types. 1.2 1.0 0.8 0.6 0.4 0.2 0 1970 1975 1980 1985 1990 1995 Tropical forests Temperate forests
Biodiversity Decline: Red List Index Measures changes in number of species in each Red List category and number changing categories between successive threat assessments. Butchart et al. (2004).
Proposed global indicators Sustainable use, e.g.: • area of forest, agriculture and aquaculture ecosystems under sustainable management • proportion of products derived from sustainable sources Threats to biodiversity, e.g.: • nitrogen deposition • numbers and cost of alien invasions
Atmospheric nitrogen deposition 1860 1993
Proposed global indicators Ecosystem integrity, goods and services, e.g.: • trophic indices (marine and potentially others) • connectivity/fragmentation • water quality in aquatic ecosystems • biodiversity used in food and medicine
Ecosystem Services and Human Well-being Millennium Ecosystem Assessment 2003
Proposed global indicators Indicators concerned with: • status of traditional knowledge, innovations, and practices • status of access and benefit sharing • status of resource transfers, including both ODA and technology transfer
GEF funded project (FSP) • Building a partnership to track progress at the global level in achieving the 2010 biodiversity target (www.twentyten.net) • PDF B ($500K), and two full project stages: • 2006-2009 - Indicator development and testing ($6m) • 2009-2012 - Reporting and looking ahead ($6m)
Monitoring and indicators - many partners and scales
Communicating 2010 indicators • Supporting the regular delivery of global 2010 biodiversity indicators through web and other media • Reporting to the CBD through GBO, and other audiences through a range of mechanisms and process. • Opportunity for key link with C2010. www.twentyten.net