Data Requirements for Biodiversity Indicators
Data Requirements for Biodiversity Indicators. Carlo Heip Centre for Estuarine and Marine Ecology Netherlands Institute of Ecology Ghent University, Belgium State University of Groningen, The Netherlands c.heip@nioo.knaw.nl. Biodiversity: what is it?.

Data Requirements for Biodiversity Indicators
E N D
Presentation Transcript
Data Requirements for Biodiversity Indicators Carlo Heip Centre for Estuarine and Marine Ecology Netherlands Institute of Ecology Ghent University, Belgium State University of Groningen, The Netherlands c.heip@nioo.knaw.nl
Biodiversity: what is it? • The variability among living organisms from all sources, including inter alia, terrestrial, marine and other aquatic ecosystems and the ecological complexes of which they are part; this includes diversity within species, between species and of ecosystems. • The totality of genes, species and ecosystems in a region. • Biological variation
Why marine biodiversity matters • Species are disappearing at a rate never observed since life began on earth. The extinction crisis ranks with global climate change as the greatest threat to the integrity of the biosphere in the 21st century • Species extinction is not just an aesthetic or moral problem. Marine organisms play a crucial role in almost all biogeochemical processes that sustain the biosphere, and provide a variety of products (goods) and functions (services) which are essential to mankind’s well-being
The rate and efficiency of any of the processes that marine organisms mediate, as well as the range of goods and services that they provide, are determined by interactions, between organisms, and between organisms and their environment, and therefore by biodiversity. • These relationships have not yet been quantified, and we are at present unable to predict the consequences of loss of biodiversity resulting from environmental change in ecological, economic or social terms.
Marine Biodiversity: what are the threats? • Overexploitation of resources • Physical alteration of the coastline • Pollution and eutrophication • Introduction of ‘exotic’ species • Global climate change
What is at stake? • Marine resources (goods) • Genetic resources • Example: Pompei worm • Species • Fisheries, aquaculture: 100 MT of food • Habitat • Tourism • Functioning of marine ecosystems (services) • Relationship between species and biogeochemical processes
A better understanding of marine biodiversity requires • Knowledge of existing biodiversity: inventories • Understanding of how biodiversity changes in space and through time, both now and in the past • Ergo: surveys and monitoring • Interpreting these changes in terms of a theory • Experiments and modelling
FUNDAMENTAL QUESTIONS • For a targeted range of environments and field sites, environmental genomics can address: • Which genes are turned on, and what do they do? • Is there intraspecific variation in gene expression in response to environmental change, and is this variation adaptive? • What are the ecosystem-, community-, and population-level consequences of the molecular transformations performed by these genes? • Which taxa are involved? • What happens if the system is experimentally perturbed
NSF Press Release November 2001 • Scientists funded in part by the National Science Foundation (NSF) and affiliated from the University of Delaware and Amersham Biosciences, Inc., in Piscataway, New Jersey, have succeeded in conducting the first-ever DNA sequencing experiments at sea. Using the research vessel Atlantis and submersible Alvin, the team carried out a pioneering environmental genomic study of the strange life that inhabits super-hot hydrothermal vents almost two miles deep in the Pacific Ocean
Genome Science and Bioinformatics • One of the core activities in genomics is to establish integrated Web-based databases and research interfaces. • Bioinformatics deals with the computational management of all kinds of biological information. It develops the mathematical tools required for analysing and processing the information in those databases • At some stage as the data obtained in genomics research will be linked to information on species, including geographical and environmental information and using methods developed in bioinformatics
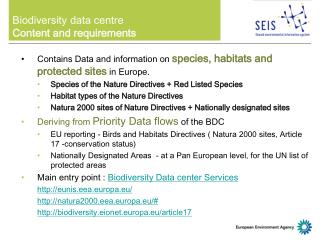
Inventorying and Monitoring of Species Diversity • The rational use and conservation of marine biodiversity requires programmes of inventorying and monitoring that allow understanding the past and present states of biodiversity and the causes of its change. • Inventories establish a baseline distribution of biodiversity for a particular place at a particular time. • Monitoring addresses the issue of change or lack of change of biodiversity through time at particular places. • Ideally, modelling should allow for predicting future states of biodiversity
Why surveys and monitoring are required. • Inventories and monitoring serve to set the baseline against which changes can be evaluated. • Monitoring is the only way to keep track of the state of the system, which is necessary because • Much change is triggered by random events. • Accidents will happen. • Monitoring is required to evaluate effects of policy measures. • Time series data become more valuable when they are longer. Much variation is in the longer time periods • Validation and calibration of ecological models can only be done on the basis of real data. The longer the time series the better the models perform.
Inventorying and Monitoring: How? • The goal of an inventorying and monitoring program of biodiversity is to document patterns of change in order to understand the impact of natural or anthropogenic disturbance on species composition and abundance in communities and ecosystems. • An inventory establishes a baseline for the distribution of biodiversity at a particular place and a particular time. • Monitoring addresses the issue of change or lack of change of biodiversity through time at particular places, against the baseline
Setting up a baseline by a network of sites • A network of sites can survey and monitor biodiversity in space and in time simultaneously • An ideal network of sites would cover a selection of critical ecosystems and cover: • Areas with marginal or undetectable impact versus (heavily) impacted areas • Transition zones between biogeographical regions and sites which are aligned along gradients such as longitude, latitude, salinity • Sites which have been intensively studied and have well established species lists, coupled with meteorological and ecological data sets.
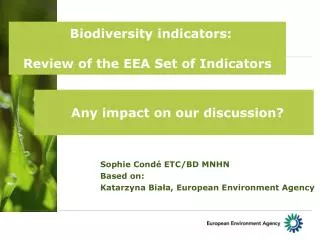
European Marine Biodiversity Research Sites ATBI Focal sites Impacted Reference sites Non-impacted LTBR
European Marine Biodiversity Research Sites 148 research sites, of which 38 are reference sites WP1: Candidate Reference and Focal sites: - ATBI (red dots) - other sites (blue dots)
Direct indicators of Biodiversity at Different levels Habitat diversity as measured by remote sensing, acoustic or imaging methodsAll Taxon Biodiversity InventoryDiversity indices e.g. Hill or Renyi numbers (Species richness, Shannon-Wiener etc) of selected taxonomic groupsTaxonomic distinctnessBenthic community analysisDiversity of ecosystem engineersInvading SpeciesPopulation structureGenetic diversity • Within a research site • Within a habitat or community • Within a population
Existing Data • Taxonomic collections: information on taxa with or without geographical information or reference to authors • Local and Regional Faunas and Floras: lists with geographical references • Biogeographical research • Paleo-ecology • Environmental research and Monitoring • Fisheries and aquaculture data • Ecological research: quantitative and qualitative • Proxies • …
Problems • No systematic collection • No reference to sites • No standardization in collecting methods • No quality control • Not electronically available
Requirements for new data • A standard minimum set and sampling methodology of environmental variables • Space (geographical location) and Time • Temperature, light, nutrients (salinity) regime • Substrate for benthic populations, water column structure for pelagic populations • …. • Standard methodologies for biodiversity measurement • Electronically available on the Web using adequate data-base structure • Application and Development of Bioinformatics (data mining software, ….)
Biological Relevance • Changes in the indicator can be measured • The indicator changes in response to stress • Intensity of changes relate to intensity of stressors • Changes are biologically important and can be detected early enough to prevent catastrophic effects • Methodological Requirements • Easy to use in the field • Easy to analyze and interpret data • Measures what it is supposed to measure • Can be used to test management questions • Can be used for hypothesis testing • Societal Relevance • Of interest to the public • Easily understood by the public • Measures aspects of the environment that relate to human health or ecological services provided by the environment • Cost-effective Key features of ‘indicators’
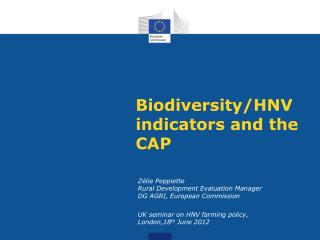
The PSR model was developed in the 1970s by the Canadian statistician Anthony Friend, and subsequently adopted by the OECD’s State of the Environment (SOE) group. The European Commission’s indicator development follows this framework. Some organisations prefer variants of the PSR model; for example, the UN Commission for Sustainable Development (UNCSD) bases its indicator set on the Driving force-State-Response model (DSR) model, which allows for a better inclusion of non-environmental variables. The Pressure-State-Response model Statistical Office of the European Commission (EUROSTAT).
For practical purposes, the PSR model is sufficient. However, for compatibility reasons (e.g. to the DSR model), and for a better description of underlying economic trends, the indicator community has formulated the Drivers-Pressure-State-Impact-Response model, which includes PSR as special cases. The UN CSD indicator process uses the DSR model, where the term “Driving Forces” is used synonymous for “Pressure”. The Driving force-Pressure-State-Impact-Response model
Inventories and exploration • Environmental genomics • Mechanisms of origin and maintenance • Role in ecosystem functioning • Invading species • Etc.etc. Scientific priorities Management priorities • Key issues • Eutrophication • Fishing • Pollution • Conservation • etc. Marine Biodiversity • Global • European • Regional • Local • Long term (10+) • Ph.D. term (3-4) • Short term (<1) Biodiversity data Socio-economic Ecosystem data DNA sequences Species abundances Benthic mapping Remote Sensing Socio-economic drivers Primary production Mineralisation Nitrogen fixation Etc. Chemical and Physical Processes
Can we do it? • Need for handling massive data of very different nature, origin, quality, … • Bioinformatics: a quantum jump in the level of expertise and sophistication required • Best start with a number of Pilot projects • Networking within Europe (6th framework programme) and globally (Census of Marine Life)
ESF Research Objectives • To characterise marine biodiversity at a range of biological, spatial and temporal scales. • To quantify the role of marine biodiversity in providing goods and services in both relatively natural and more human-impacted environments. • To determine the probable effects of natural and man-made changes in biodiversity on ecosystem goods and services. • To provide a scientific rationale and tools for the proper management of living resources in European seas.
MARBEF EoI Research Objectives 1. Exploring marine biodiversity in Europe. 2. Determining the relationship between ecosystem functioning and biodiversity. 3. Exploring the relationship between species and the stability of ecosystems, including functional groups and the role of rare species 4. What determines the success or failure of invasive species. 5. What are the large-scale gradients in species richness and how do they change in time. 6. What is the relationship between ecosystem functioning and the sustainable use of marine biodiversity across Europe and globally.
Bioinformatics • Bioinformatics is the study of the inherent structure of biological information and biological systems. It brings together the avalanche of systematic biological data (e.g. genomes, but going on to ecosystems) with the analytic theory and practical tools of mathematics and computer science
First, the data produced by the thousands of research teams all over the world are collected and organized in databases specialized for particular subjects. Well-known examples are: GDB , SWISS-PROT , GenBank , and PDB. The latter - for example - deals with three-dimensional structures of biological molecules.
In the next step, computational tools are needed to analyse the collected data in the most efficient manner. For example, many bioinformaticists are working on the prediction of the biological functions of genes and proteins (or parts of them) based on structural data
Bioinformatics is a newly emerging interdisciplinary research area which may be defined as the interface between biological and computational sciences. Although the term 'Bioinformatics' is not really well-defined, you could say that this scientific field deals with the computational management of all kinds of biological information, whether it may be about genes and their products, whole organisms or even ecological systems.
Species diversity • Its structure: life has originated in the sea and is much older in the sea than on land. As a consequence, the diversity of higher taxonomic levels is much greater in the sea where there are 14 endemic (unique) animal phyla whereas only 1 phylum is endemic to land • Its function: Marine organisms play crucial roles in many biogeochemical processes that sustain the biosphere, and provide a variety of products (goods) and functions (services) which are essential to mankind’s well-being, including the production of food and natural substances, the assimilation of waste and regulation of the world’s climate