Sample Proportions
Explore the properties of sample proportions and the Normal approximation in statistics, focusing on shape, center, and spread of distributions. Learn how to use Normal calculations for accurate probability estimations.

Sample Proportions
E N D
Presentation Transcript
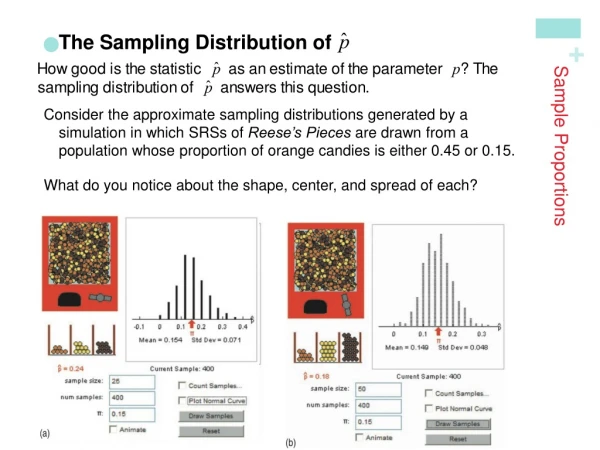
Sample Proportions • The Sampling Distribution of Consider the approximate sampling distributions generated by a simulation in which SRSs of Reese’s Pieces are drawn from a population whose proportion of orange candies is either 0.45 or 0.15. What do you notice about the shape, center, and spread of each?
Sample Proportions • The Sampling Distribution of What did you notice about the shape, center, and spread of each sampling distribution?
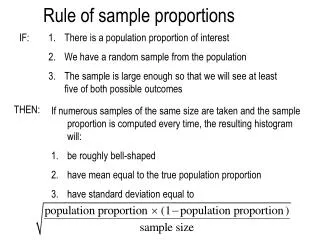
Sample Proportions • The Sampling Distribution of In Chapter 8, we learned that the mean and standard deviation of a binomial random variable X are As sample size increases, the spread decreases.
Sample Proportions • The Sampling Distribution of Sampling Distribution of a Sample Proportion As n increases, the sampling distribution becomes approximately Normal. Before you perform Normal calculations, check that the Normal condition is satisfied: np ≥ 10 and n(1 – p) ≥ 10.
Sample Proportions • Using the Normal Approximation for A polling organization asks an SRS of 1500 first-year college students how far away their home is. Suppose that 35% of all first-year students actually attend college within 50 miles of home. What is the probability that the random sample of 1500 students will give a result within 2 percentage points of this true value? STATE: We want to find the probability that the sample proportion falls between 0.33 and 0.37 (within 2 percentage points, or 0.02, of 0.35). PLAN: We have an SRS of size n = 1500 drawn from a population in which the proportion p = 0.35 attend college within 50 miles of home. Since np = 1500(0.35) = 525 and n(1 – p) = 1500(0.65)=975 are both greater than 10, we’ll standardize and then use Table A to find the desired probability. DO: CONCLUDE: About 90% of all SRSs of size 1500 will give a result within 2 percentage points of the truth about the population.
Section 7.2Sample Proportions Summary In this section, we learned that… • In practice, use this Normal approximation when both np ≥ 10 and n(1 - p) ≥ 10 (the Normal condition).