Download
1 / 12
120 likes | 156 Vues
Learn how to describe and apply sample proportions distribution, rules of thumb, and approximations for data analysis in statistics. Practice with examples and calculations to enhance understanding.

E N D
The Distribution of Sample Proportions Section 9.2.1
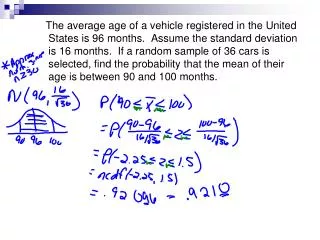
Starter 9.2.1 • The distribution of I.Q.’s in a certain school is known to be N(100,12) A randomly chosen student is found to have an I.Q. of 85. • What is the z-score of this student? • Sketch a standard normal curve. Label the axis and show the z-score • What was the probability that the student would have an I.Q. this low or lower?
Today’s Objectives • Describe the shape, center, and spread of the sampling distribution of when a sample of size n is taken from a population • Apply two “rules of thumb” to determine whether the standard deviation formula and the normal approximation apply California Standard 16.0 Students know basic facts concerning the relation between the mean and the standard deviation of a sampling distribution and the mean and the standard deviation of the population distribution.
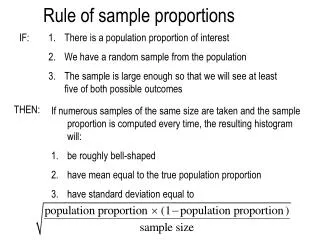
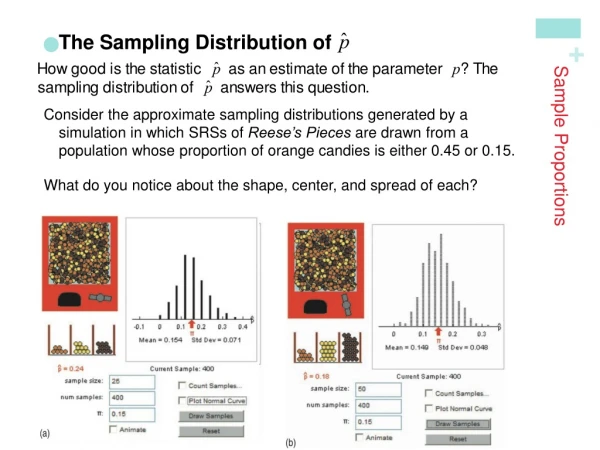
The Sampling Distribution of • Shape: The sampling distribution of sample proportions will be approximately normal • The larger the sample size, the better the approximation • Center: The mean of the sampling distribution is exactly p (the true population proportion) • Spread: The standard deviation of the sampling distribution is
Rules of Thumb(When do we get to use the normal approximation?) • The formula for standard deviation formula is valid only when the population is at least 10 times as large as the sample size • The normal approximation is valid only if the expected counts of BOTH success and failure are at least 10 • As a formula, this is written:
Example 9.4 • 1500 college freshmen were asked whether they applied for admission to any other college than the one they chose. • Assume the true nationwide proportion is 35%. What is the probability that this sample will give a result within 2% of the true value? • In other words: If p = .35, find the probability that is between .33 and .37 • Check both rules of thumb for validity. • If valid, find the probability.
Answer • The population of all college freshmen is clearly more than 10 x 1500, so we can use the standard deviation formula. • The sample size n is large enough (1500) that there will certainly be at least 10 in each group, so we can assume a normal distribution. • What is the mean of the distribution of p-hat? • Calculate the standard deviation of the distribution of p-hat. • Calculate the probability that 0.33<p-hat<0.37: • Normalcdf(.33,.37,.35,.0123) = .896, so there is about a 90% probability that the sample will be within 2% of the true value
Example 9.5 • A recent survey of 1500 American adults contained 9.2% blacks even though blacks make up about 11% of the population. Should we suspect undercoverage bias? • To answer this, find the probability of getting a sample proportion of at most 9.2% when the true population proportion is 11%. • Check rules of thumb and do the math.
Answer • The population of all blacks is clearly more than 10 x 1500, so use S.D. formula • The sample size n is large enough (1500) that there will certainly be at least 10 in each group, so use normal distribution • Calculate the standard deviation of the statistic
Today’s Objectives • Describe the shape, center, and spread of the sampling distribution of when a sample of size n is taken from a population • Apply two “rules of thumb” to determine whether the standard deviation formula and the normal approximation apply California Standard 16.0 Students know basic facts concerning the relation between the mean and the standard deviation of a sampling distribution and the mean and the standard deviation of the population distribution.
Homework • Read pages 472 - 477 • Do problems 15, 17, 19 - 21
Homework Question 9.15 • The Gallup Poll once asked a random sample of 1540 adults, “Do you happen to jog?” Suppose that in fact 15% of all adults jog. • Find the mean and standard deviation of the proportion p-hat of the sample who jog. (Assume the sample is an SRS.) • Explain why you can use the formula for the standard deviation of p-hat in this setting. • Check that you can use the normal approximation for the distribution of p-hat. • Find the probability that between 13% and 17% of the sample jog. • What sample size would be required to reduce the standard deviation of the sample proportion to one-half the value you found in (a)?