Download

1 / 25
250 likes | 457 Vues
Sampling Distribution of the Sample Mean. Example. Let X denote the lifetime of a battery Suppose the distribution of battery battery lifetimes has mean lifetime, = 400 hours standard deviation of lifetimes, s = 40 hours. A Sample of Size n is Taken.

E N D
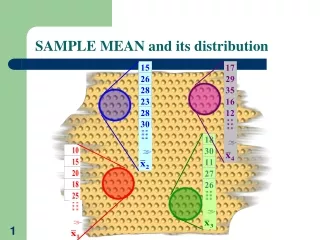
Sampling Distribution of the Sample Mean
Example Let X denote the lifetime of a battery Suppose the distribution of battery battery lifetimes has • mean lifetime, = 400 hours • standard deviation of lifetimes, s = 40 hours
A Sample of Size n is Taken • Calculate the mean of these n batteries • Then another sample of size n batteries is taken • The mean of this second sample of n batteries is calculated • This is done again, and again, and again, and ….
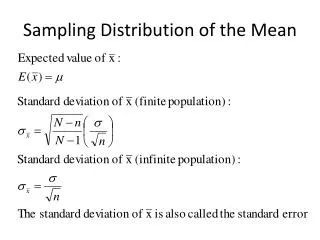
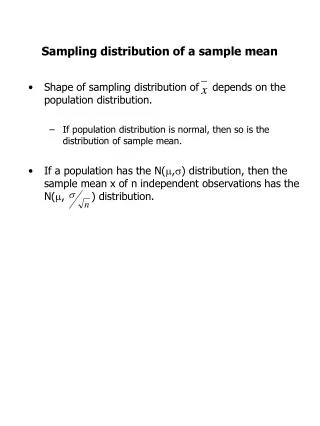
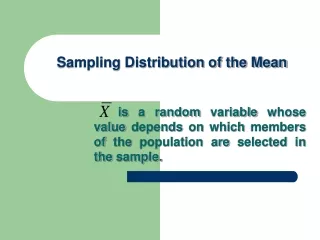
X (Life of a battery) is normal, and • σ is known Distribution of
Even if X does not have a normal distribution, will be approximately normal if n is large. Central Limit Theorem n = 30 is usually large enough to use this approximation.
ExampleWhen Distribution of X is Normal X = the life of abattery • Assume battery life is: • Distributed normal • Mean battery life = 400 hours • Standard deviation of battery life = 40 hours • We choose a battery at random • The battery lasts 350 hours • This is an observation of X
X x = 350 Observation of X = 40 μ = 400
The Random Variable • Suppose random samples of size n = 4 batteries are selected independently and their sample means calculated • These are observations of the random variable
AN OBSERVATION OF • Suppose 4 batteries are selected and their lives are: 420, 450, 380, 390 • Their average = (420 + 450 + 380 + 390)/4 = 410 • This is an observation of a random variable for the Sample Mean
_X Sampling Distribution and anObserved Value
= 400 x = 350 Observation of XWhen X is Not Normal f(x) = 40 X
AN OBSERVATION OF • Suppose 4 batteries are selected and their lives are: (410, 450, 360, 360) • Their average = (410 + 450 + 360 + 360)/4 = 395 • This is an observation of a random variable for the Sample Mean • But the sample size is small so we do not know the distribution of -- we can’t plot it
Using A Larger Sample Size • Suppose 100 batteries are selected and their lives are: (420, 450, 380, 350,…., 415) • Their average = (420 + … + 415)/100 = 408 • This is an observation of the random variable (where n = 100) • Because this is a large sample, the distribution of is approximately normal
_X Sampling Distribution and anObserved Value
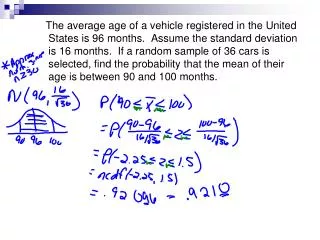
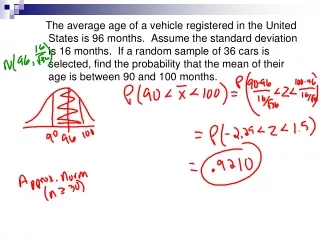
EXAMPLES • Answer the following questions assuming: • Battery life is distributed normal • Battery life distribution is not normal (or unknown) • What is the probability: • a random battery will last longer than 408 hours? • the average of life of 16 batteries be longer than 408 hours? • the average life of 100 batteries will be longer than 408 hours?
1 - .5793 = .4207 .5793 408 P(X > 408)X normal = 40 400 X 0 Z .20
? P(X >408)X Not Normal = 40 = 400 x = 408 X
1 - .7881 = .2119 _X 400 408 _ P(X >408) X Normal, n = 16 .7881 0 Z .80
_ P(X >408) X Not Normal, n = 16 • Can’t do • X is Not Normal and n is small • So we do not know the distribution of the Sample Mean
1 - .9772 = .0228 _X 400 408 _ P(X >408) X Normal, n = 100 .9772 2.00 0 Z
1 - .9772 = .0228 _X 400 408 _ P(X >408) X Not Normal, n = 100 .9772 2.00 0 Z
Using Excel • As long as it can be assumed that the distribution of the sample mean is normal, NORMDIST and NORMINV can be used to give probabilities except: • Instead of using , put in /n • Let Excel do the arithmetic • Example: Find the probability the average of 100 batteries exceeds 408 hours
Review • Given a distribution X, with and known -- for samples of size n: • If X is normal and is known • If X is not normal