Modeling Multi-Phase Systems Using Bond Graphs
This comprehensive work by Jürgen Greifeneder and François Cellier explores the modeling of multi-phase systems using bond graphs. It covers the foundational aspects of building basic models, determining variables such as mass and volume flows, and examining phase transitions, including condensation on cold surfaces. A detailed model of a pressure cooker is presented to illustrate key concepts. The text emphasizes the complexity of phase transitions and provides methods to effectively model them while accounting for the dynamics of fluid and gas interactions.
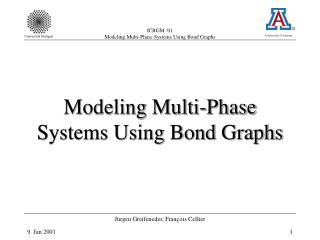

Modeling Multi-Phase Systems Using Bond Graphs
E N D
Presentation Transcript
Modeling Multi-Phase Systems Using Bond Graphs Jürgen Greifeneder, François Cellier
Contents • Introduction • Basic Model • Determination of Variables • Condensation on Cold Surfaces • Model of a Pressure Cooker • Conclusions Jürgen Greifeneder, François Cellier
Basic Model Ø CD, DVA, Evaporation (and Condensation) Ø 3 3 3 3 CF CF gas liq Jürgen Greifeneder, François Cellier
Determination of Variables • State transition elements are modeled as special R-fields, however: • Mass flows are determined as a function of pressure and the corresponding saturation pressure • Volume flows are determined as the product of mass flow and the saturation volume at the corresponding temperature • Entropy flows will be superposed with enthalpy of evaporation Jürgen Greifeneder, François Cellier
Condensation on Cold Surfaces Boundary layer CF CF Gas Gas Rand- schicht 3 3 CD DVA RF 3 3 . Ø Ø CD s S T 3 gas 3 Conduction (CD) Volume work (DVA) Condensation- and Evaporation Conduction (CD) Volume work (DVA) Condensation- and Evaporation CF 3 Ø Surface . s 3 T S 3 liq CD DVA RF 3 3 Ø Ø CD 3 3 CF CF liq liq Jürgen Greifeneder, François Cellier
Model of a Pressure Cooker Air in Boundary layer SE: 393 K CD (t) CD DVA CD (t) Air RF: Dp CD (t) CD CD SE: 293 K CD DVA CD DVA Cond water CD CD steam RF: Dp CD (t) DVA Cond CD Steam in Boundary layer CD (t) Jürgen Greifeneder, François Cellier
Pressure Cooker: Temperature Graph Jürgen Greifeneder, François Cellier
Pressure Cooker: Pressure Graph Jürgen Greifeneder, François Cellier
Conclusions • Phase transitions cannot be described in general without making assumptions • Simple phase transitions can now be modeled • This model accounts also for liquid within the gaseous phase and air bubbles within the fluid phase. • Condensation on cold surfaces can be modeled easily. Jürgen Greifeneder, François Cellier
Thank you. Jürgen Greifeneder, François Cellier
Gas Phase CF CF Gas liq 3 3 3 3 Ø CD, DVA, Condensation (and Evaporation) Ø 3 3 3 CD, DVA Transition element Transition element Phase- boundary 3 3 3 3 Ø CD, DVA, Evaporation (and Condensation) 3 Ø 3 3 CF CF Fluid Phase gas liq Modeling Air Bubbles Jürgen Greifeneder, François Cellier