Download
1 / 22
220 likes | 482 Vues
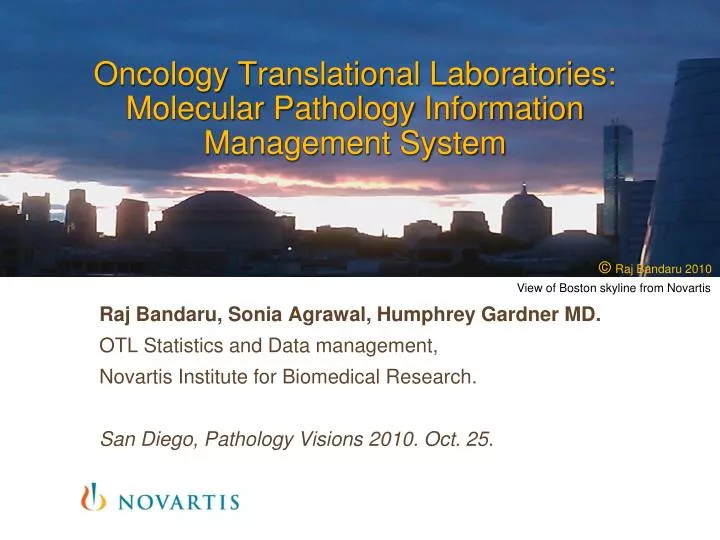
Oncology Translational Laboratories: Molecular Pathology Information Management System. Oncology Translational Laboratories: Molecular Pathology Information Management System. © Raj Bandaru 2010. View of Boston skyline from Novartis. Raj Bandaru, Sonia Agrawal, Humphrey Gardner MD.

E N D
Oncology Translational Laboratories: Molecular Pathology Information Management System Oncology Translational Laboratories: Molecular Pathology Information Management System © Raj Bandaru 2010 View of Boston skyline from Novartis Raj Bandaru, Sonia Agrawal, Humphrey Gardner MD. OTL Statistics and Data management, Novartis Institute for Biomedical Research. San Diego, Pathology Visions 2010. Oct. 25.
Biomarkers of increasing significanceNovartis commitment to biomarkers in Treating patients • Biomarkers in drug discovery and therapeutic paradigms: High priority effort at Novartis. • Numerous clinical trials underway focused on getting the best treatments to the right patients. • Deeply invested in measuring and understanding various biomarkers in all our clinical studies (Pre, Phases 1 – 3 and post marketing). • A highly data (biomarker) driven process that involves sampling and collection of a large volume of data driving real time decisions. • The Oncology Translational labs: center of excellence in Novartis to ensure high quality and timely data delivery for making critical treatment decisions • Large part of this data is generated within our own labs to ensure high quality and fidelity across studies. • Biomarkers in drug discovery and therapeutic paradigms: High priority effort at Novartis. • Numerous clinical trials underway focused on getting the best treatments to the right patients. • Deeply invested in measuring and understanding various biomarkers in all our clinical studies (Pre, Phases 1 – 3 and post marketing). • A highly data (biomarker) driven process that involves sampling and collection of a large volume of data driving real time decisions. • The Oncology Translational labs: center of excellence in Novartis to ensure high quality and timely data delivery for making critical treatment decisions • Large part of this data is generated within our own labs to ensure high quality and fidelity across studies. 2 | Oncology Translational Labs IMS| Raj Bandaru | 20101024 | Informatics | Business Use Only
Customer: Oncology Translational LabsMulti site / multi platform integration... In real time • Tissue Biomarker Group (IHC), • Molecular Pathology Lab, (CAP) • Molecular Profiling Lab, (CAP/CLIA) • DNA analyses/mutation detection • ELISA and proteomics • Flowcytometry Lab • Gene expression Profiling Tissue Biomarker Group (IHC) Cambridge, MA Basel, Switzerland East Hanover, NJ 6 pathologists, 12 Histotechs .. Over 60 users across 3 sites 4 Aperio ®scanners 9 Ventanas ®, 2 Nemesis 2 CRI ® scanners/ imaging stations 2 3D Histech ®scanners, Laser Microdissection Circulating Tumor Cells, VeridexCelltrax ® Sequenom ®, Fluidigm ®, Dxs, RTPCR, Affymetrix ®, Nanostring® ABI® sequencers... Powerpath ® (validated database for CAP lab) ~ 15000 samples per year (~ 70,000 slides) Validated assays for > 30 analytes, FISH, CISH, mutation/copy number analyses = Millions of data points! In hundreds of Spreadsheets, emails, and other documents 3 | Oncology Translational Labs IMS| Raj Bandaru | 20101024 | Informatics | Business Use Only
Life before the LIMSSpreadsheets, emails... Perl scripts • Samples and data recorded and tracked in Excel Spreadsheets. • Laboratory processes not tracked or in systems not accessible (Ventana system) • Pseudo audit trails (periodic time stamped back up of all data files using local scripts) • Multiple data entry, sample tracking sheets, Ventana staining systems, Aperio image database and Pathologist data entry. • Data transfer and sharing via emailing of spreadsheets • Data uploads to validated systems involved multiple independent and repeated cross checks using non validated scripts. 4 | Oncology Translational Labs IMS| Raj Bandaru | 20101024 | Informatics | Business Use Only
Tough LifeErrors, duplication of effort, redundancy and confusion • Limited sharing/ security/audit trails/back up of the data • Structure of folder / files not defined by the process in the labs • Non transferable/ searchable data (color coding/ formatting of cells) • No controlled vocabulary/ validation of data entries. • Identified several errors and missing data (not entered or accidentally deleted) in 2 years of legacy data. (from spreadsheets prior to 2006). • Very difficult to implement automation, triggers, reminders. © Raj Bandaru 2010 “Black clouds over San Diego Bay” taken with DroidX, Oct. 23rd AM 5 | Oncology Translational Labs IMS| Raj Bandaru | 20101024 | Informatics | Business Use Only
Off the shelf solutionsGaps Primary limitation of off the shelf systems was the need for extensive customization, expensive maintenance contracts/ consultation fees. ... And still require internal support teams. Watson LIMS IHC... FISH... Copy number... RNA profiling.. DNA sequencing... Molecular Profiling Assays What was missing Range of Biomarker Assays Histo Pathology Assays Aperio Spectrum Powerpath Ventana LIMS Increasing Automation/Digitization 6 | Oncology Translational Labs IMS| Raj Bandaru | 20101024 | Informatics | Business Use Only
Phased implementationstep by step development with the big picture in mind. Data sources/ Labs Aperio ® Clinical Statistics STS Enrollment Log OTL db IHC data export SMU RNA Spotfire® R toolbox Flow Independent database ELISA Reports Analysis Datamining Imaging Misc. spreadsheets External data Preclinical/ cell line data etc. 7 | Oncology Translational Labs IMS| Raj Bandaru | 20101024 | Informatics | Business Use Only
Key RequirementsWhat Information is tracked • Log and track samples, child samples, arrays and sample meta data (subject information, diagnosis), by studies/ projects, tissue microarrays. • Create tasks/experiments, request tasks, log task metadata and process details. • Two way communication link between Lab instruments and the LIMS. • Store results/ data features associated with samples and compiled data sets and associated analyses programs (SAS ® / R ® / Inform ®) and reports with e-signatures • Link to external sample related data (images, pathology reports). • Link to data mining/ analyses/visualization engines (Spotfire ®) • Multilevel security, access restrictions at data and functionality level. • Audit trail of edits, frequent back ups of data with recovery plans. • Flexible and complex query interface to generate reports. • Multisite synchronization of data, load distribution and performance opt. • Automated emailing/ reminders / task tracking/ report generation. • Customizable control vocabulary, data features, form display formatting. 8 | Oncology Translational Labs IMS| Raj Bandaru | 20101024 | Informatics | Business Use Only
Interim SolutionsPreparing the labs for change • Implemented automated backups and versioning of the spreadsheets and data files. • Updated spreadsheets automatically with data entered to the database. • Partial integration with Aperio ® Spectrum via barcode scanning and scripts to synchronize databases. • Implemented Powerpath ® a validated database for the CAP/ CLIA certification. • Some limited customization of Spectrum ® and Powerpath ®. • Set up scripts to extract data from Ventana ®run reports and load into the LIMS. • Started synchronizing sample identifiers across labs. © Raj Bandaru 2010 9 | Oncology Translational Labs IMS| Raj Bandaru | 20101024 | Informatics | Business Use Only
ArchitectureValidation focussed • Windows server running Apache 2.0 Web server and PHP • 64 bit Windows server running MSSQL 2005. (dev and prod instances) • Plans to migrate production systems to validated servers (2011) • Low level PHP/javascript/AJAX : highly structured code. • Interface design, structure, actions, validation rules and function calls stored within tables in database • High on performance and ease of use, Low on bells and whistles. • Highly modular, easily maintainable code. (Basic PHP developer friendly), Code folders structure reflecting interface design, all SQL in one location/class. Globals functions in specific classes Database form generator form processing form editing Lookup form elements, actions, form layout specified in table 10 | Oncology Translational Labs IMS| Raj Bandaru | 20101024 | Informatics | Business Use Only
DesignCFR21 Part 11 • Approximately 65 tables and ~ 10 views plus audit trail. • No records are ever deleted from the database, just moved to mirrored set of tables. • Access restrictions by user/ user groups at the level of tables, fields in a table or specific data elements. • Very minimum server dependent functionality to enable easy porting to other database servers. • Normalized database with Optimized queries and compound indexing. 11 | Oncology Translational Labs IMS| Raj Bandaru | 20101024 | Informatics | Business Use Only
Interfacesimple, clean and intuitive 12 | Oncology Translational Labs IMS| Raj Bandaru | 20101024 | Informatics | Business Use Only
InterfaceSimple and low learning curve • Followed an Excel spreadsheet like feel, but via the web interface. • Minimal user key strokes for data entry. • Arrange tabs in order of workflow in the labs. • Highly flexible query interface capable of complex searches with unlimited filters and user defined reports. • Ability to save searches and set up cron jobs to run searches/reports. • User customizable web interface, formatting of fields, yet simple look and feel. 13 | Oncology Translational Labs IMS| Raj Bandaru | 20101024 | Informatics | Business Use Only
Timelines and ResourcesRapid development/ testing cycles Release Version 1: IHC sample tracking Rel. Ver. 2 Task Management Rel. Ver. 2.1 Ventana Integration Started Development Data input function Beta Release DNA lab May 2007 May Sept. 2008 May Oct. 2009 April 2010 Jan. 2011 • On average one or two full time developers at any point. Indicated by blue arrows above. • Long term plan is to make code open source community include in a public library for everything from LIMS to image and data analyses for the Digital Pathology community 14 | Oncology Translational Labs IMS| Raj Bandaru | 20101024 | Informatics | Business Use Only
Light at the end of the tunnelHappy Pathologists and Histotechs • Database contains over 120,000 records. (All legacy data ported over). • Modular code has allowed for rapid development of new functionality (< 1 week from design to testing and production release) • Far fewer errors or mistakes in the labs. Zero data errors. • Some database performance issues to be resolved. • Integration of other laboratory instruments and imaging stations. © Raj Bandaru 2010 15 | Oncology Translational Labs IMS| Raj Bandaru | 20101024 | Informatics | Business Use Only
What is AheadAutomation everywhere... • Complete CFR21 part 11 Validation of the entire system. • Reporting (Spotfire/business objects) and extend interface and reporting on mobile devices • Web access to analyses scripts and tools (SAS, R, Matlab code). • Implement processing tasks creation logic interface. • Wider acceptance of barcoding/ standardization of procedures. • Text mining and knowledge management tools. Integrate with other imaging and biomarker databases... MICAD, protein atlas, ncbi GEO, Pubmed. • General cosmetic/performance improvements. Google like searches. © Raj Bandaru 2010 16 | Oncology Translational Labs IMS| Raj Bandaru | 20101024 | Informatics | Business Use Only
What is Ahead Integration across technologies Image Analyses with DNA analyses processes. Track entire flow and process in the LIMS Automated Tumor finding algorithms. (CRI ® inform) LCM and microdissect tumor region Send for DNA analyses Histotech supervise Pathologist verify Analyses of Circulating Tumor cells and accessibility of images and results to Pathologists. HSP 70 CK-PE CD45APC Processing of TMA core and Fluorescence images (CRI ® software) Track and store application settings, data outputs and resulting images. Make results available via visualization tools. 17 | Oncology Translational Labs IMS| Raj Bandaru | 20101024 | Informatics | Business Use Only
Thank youDemo of development version 18 | Oncology Translational Labs IMS| Raj Bandaru | 20101024 | Informatics | Business Use Only
Screen shotsOTL database 19 | Oncology Translational Labs IMS| Raj Bandaru | 20101024 | Informatics | Business Use Only
Screen shotsOTL database 20 | Oncology Translational Labs IMS| Raj Bandaru | 20101024 | Informatics | Business Use Only
Screen shotsOTL database 21 | Oncology Translational Labs IMS| Raj Bandaru | 20101024 | Informatics | Business Use Only
Screen shotsOTL database 22 | Oncology Translational Labs IMS| Raj Bandaru | 20101024 | Informatics | Business Use Only