Biomedical Statistics Testing for Normality and Symmetry
240 likes | 409 Vues
Biomedical Statistics Testing for Normality and Symmetry. Teacher:Jang-Zern Tsai ( 蔡章仁 ) Student: 邱瑋國. outline Graphical Tests Analysis of Skewness and Kurtosis Statistical Tests Chi-square test for normality Kolmogorov- Smironov

Biomedical Statistics Testing for Normality and Symmetry
E N D
Presentation Transcript
Biomedical StatisticsTesting for Normality and Symmetry Teacher:Jang-Zern Tsai (蔡章仁) Student:邱瑋國
outline • Graphical Tests • Analysis of Skewness and Kurtosis • Statistical Tests • Chi-square test for normality • Kolmogorov-Smironov • Shapiro-Wilk (original test) • Shapiro-Wilk (expanded test) • Transformations
Graphical Tests Histogram histogram can be used to test whether data is normally distributed. Determine whether the data in column B of Figure 1 are normally distributed using a histogram. the histogram doesn’t look particularly normal.
QQ Plot A PP plot (point-point plot) A QQ plot(quantile-quantileplot) Using a QQ plot determine whether the data set {-5.2, -3.9, -2.1, 0.2, 1.1, 2.7, 4.9, 5.3} is normally distributed. we have also standardized the original data so that it is easier to compare the standardized data with the standard normal approximation for each data point. Finally we have included a scatter diagram (the QQ plot) of the data vs. the standardized normal data
Real Statistics Excel Support The Real Statistics Resource Pack contains a supplemental data analysis tool which creates QQ plots automatically. In the current implementation, the data must be organized as a single column. We illustrate the use of the QQ Plot data analysis tool in the following example.
Box Plots While box plots can’t actually be used to test for normality, they can be useful for testing for symmetry, which often is a sufficient substitute for normality.
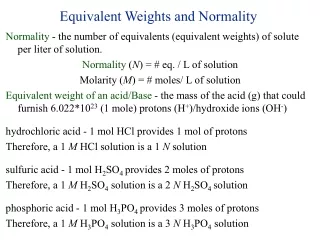
Analysis of Skewness and Kurtosis ince the skewness and kurtosis of the normal distribution are zero, values for these two parameters should be close to zero for data to follow a normal distribution. A rough measure of the standard error of the skewness is where n is the sample size. A rough measure of the standard error of the kurtosis is wheren is the sample size. If the absolute value of the skewness for the data is more than twice the standard error this indicates that the data are not symmetric, and therefore not normal. Similarly if the absolute value of the kurtosis for the data is more than twice the standard error this is also an indication that the data are not normal.
Statistical Tests for Normality and Symmetry Chi-square test for normality The chi-square goodness of fit test can be used to test the hypothesis that data comes from a normal hypothesis. In particular, we can use Theorem 2 of Goodness of Fit, to test the null hypothesis: We now perform the Chi-square goodness of fit test. Since the observed and expected frequencies of the first and last interval are less than 5, it is better to combine the 1st and 2nd as well as the last and second to last intervals. The chi-square test statistic is 4.47, which is less than the critical value of 14.07, and so we can conclude that there is a good fit. Note that the df = number of interval – 1 = 8 – 1 = 7 since the mean and standard deviation are given.
We next test the null hypothesis that the data is normally distributed using the sample mean and variance (3.74 and 2.20 respectively as see in Figure 3) as estimates for the population mean/variance. As in Example 1, we combine the first two and the last two intervals so that all frequencies are at least 5. Once again we use a chi-square goodness of fit test based on 8 intervals, but this time since the mean and variance are estimated parameters, per Theorem 3 of Goodness of Fit.n
Kolmogorov-Smirnov Test Definition 1: Let x1,…,xn be an ordered sample with x1 ≤ … ≤ xn and define Sn(x) as follows: Now suppose that the sample comes from a population with cumulative distribution function F(x) and define Dn as follows: Observation: It can be shown that Dn doesn’t depend on F. Since Sn(x) depends on the sample chosen, Dn is a random variable. Our objective is to use Dn as way of estimating F(x). The distribution of Dn can be calculated, but for our purposes the important aspect of this distribution are the critical values. These can be found in the Kolmogorov-Smirnov Table.
If Dn,α is the critical value from the table, then P(Dn ≤ Dn,α) = 1 – α. Dn can be used to test the hypothesis that a random sample came from a population with a specific distribution function F(x). If then the sample data is a good fit with F(x). Also from the definition of Dn given above, it follows that
the mean is 481.4 and the standard deviation is 155.2. We can now build the table that allows us to carry out the KS test, namely: Dn = the largest value in column G, which in our case is 0.0117. If the data is normally distributed then the critical value Dn,α will be larger than Dn. From the Kolmogorov-Smirnov Table we see that Dn,α = D1000,.05 = 1.36 / SQRT(1000) = 0.043007 Since Dn= 0.0117 < 0.043007 = Dn,α, we conclude that the data is a good fit with the normal distribution.
Shapiro-Wilk Original Test Rearrange the data in ascending order so that x1≤ … ≤xn. Calculate SS as follows: If n is even, let m = n/2, while if n is odd let m = (n–1)/2 Calculate b as follows, taking the ai weights from the Table 1 (based on the value of n) in the Shapiro-Wilk Table. Note that if n is odd, the median data value is not used in the calculation of b. Calculate the test statistic W = b2 ⁄ SS Find the value in the Table 2 of the Shapiro-Wilk Table (for a given value of n) that is closest to W, interpolating if necessary. This is the probability that the data comes from a normal distribution.
We begin by sorting the data in column A using Data > Sort & Filter|Sort or the QSORT supplemental function, putting the results in column B. We next look up the a coordinate values for n = 12 (the sample size) in Table 1 of the Shapiro-Wilk Table, putting these values in column E. Corresponding to each of these 6 coordinates a1,…,a6, we calculate the values x12 – x11, …, x7 – x6, where xi is the ith data element in sorted order. E.g. since x1 = 35 and x12 = 86, we place the difference 86 – 35 = 51 in cell. Column I contains the product of the coordinate and difference values. E.g. cell I5 contains the formula =E5*H5. The sum of these values is b = 44.1641, which is found in cell.
We next calculate SS= 2008.667. Thus W = b2 ⁄ SS= .971026. We now look for .971026 when n = 12 in Table 2 of the Shapiro-Wilk Table and find that the value lies between .50 and .90. The W value for .5 is .943 and the W value for .9 is .973. Interpolating .971026 between these value, we arrive at p-value = .873681. Since p-value = .87 > .05 = α, we retain the null hypothesis that the data are normally distributed. SHAPIRO(R1, False) = the Shapiro-Wilk test statistic W for the data in the range R1 SWTEST(R1, False) = p-value of the Shapiro-Wilk test on the data in R1 SWCoeff(n, j, False) = the jth coefficient for samples of size n SWCoeff(R1, C1, False) = the coefficient corresponding to cell C1 within sorted range R1 SWPROB(n, W) = p-value of the Shapiro-Wilk test for a sample of size n for test statistic W
Shapiro-Wilk Expanded Test The following version of the Shapiro-Wilk Test handles samples between 12 and 5,000 elements, although samples of at least 20 elements are recommended. We also show how to handle samples with more than 5,000 elements. Assuming that the sample has n elements, perform the following steps: 1. Sort the data in ascending order x1 ≤ … ≤ xn 2. Define the values m1, …, mn by mi = NORMSINV((i − .375)/(n + .25)) 3. Let M = [mi] be the n × 1 column vector whose elements are these mi and let
If M is represented by the n × 1 range R1 in Excel, then =SUMSQ(R1) calculates the value m. 4. Set u = 1/ and define the coefficients a1, …, an where ai = mi / for 2 < i < n − 1 It turns out that ai = −an-i+1for all iand that where A = [ai] is the n × 1 column vector whose elements are the ai. 5. The W statistic is now defined by Because of the above properties of the coefficients a1, …, an it turns out that W = the square of the correlation coefficient between a1, …, an and x1, …, xn. Thus the values of W are always between 0 and 1.
6. Thus we can test the statistic using the standard normal distribution. If the p-value ≤ α then we reject the null hypothesis that the original data is normally distributed. We carry out the calculations described above to get the results shown in Figure 1. The W statistic is 0.971066. The p-value = .921649 > .05 = α shows that there are no grounds for rejecting the null hypothesis that the data is normally distributed. SHAPIRO(R1) = the Shapiro-Wilk test statistic W for the data in the range R1 using the expanded method SWTEST(R1) = p-value of the Shapiro-Wilk test on the data in R1 using the expanded method SWCoeff(n, j) = the jth coefficient for samples of size n SWCoeff(R1, C1) = the coefficient corresponding to cell C1 within sorted range R1.
Note that these functions can optionally take an additional argument b: SHAPIRO(R1, b), SWTEST(R1, b), SWCoeff(n, j, b) and SWCoeff(R1, C1, b). When omitted this argument defaults to True (i.e. the values for the expanded Shapiro-Wilk test as described above are used). If b is set to False then the values for the original Shapiro-Wilk test are used instead.
This time we use the supplemental functions described above to obtain the results shown in Figure 2. The value of W and the p-value are as indicated using the formulas indicated. Since p-value = 0.019314 < .05 = α, we reject the hypothesis that the data is normally distributed. Note that we don’t need to sort the data and the data does not have to be arranged in a column to use the formulas.
If for some reason we want to obtain the coefficients, we need to sort the data. This is done by highlighting the range G3:K14 and entering =QSORT(A3:E14) and pressing Ctrl-Shft-Enter. The first coefficient is obtained by entering the formula =SWCoeff($G$3:$K$14,G3) in cell M3. If you highlight the range M3:Q14 and press Ctrl-R and Ctrl-D Observation: If a sample larger than 5,000, you can randomly divide the larger sample into a number of approximately equal-sized smaller samples and then run the SW algorithm as described above on each sample to obtain the z score for each smaller sample. Suppose that there are k such samples with z scores of z1, …, zn. Recall that if range R1 contains sample i then zi = NORMSINV(SWTEST(R1)). The average of the z-scores will be an approximation of the z value for the whole sample. The expected mean of z is the average of the means of the zi, namely 0 and the standard deviation of z should be the standard deviation of the zi divided by √k, namely 1/ . Thus you should test z/ using the standard normal distribution.
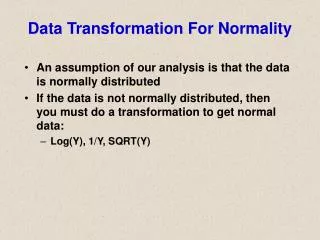
Transformations to Create Symmetry When a sample is not distributed normally, and is not even symmetric, then sometimes it can be useful to transform the data so that the transformed data is more normal or at least roughly symmetric. We touch upon the subject in Transformations, and will explore this concept a bit further in this section. When data is skewed to the left, transformations such as f(x) = log x (either base 10 or base e) and f(x) = will tend to correct some of the skew since larger values are compressed. Both of these transformations don’t accept negative numbers, and so the transformations f(x) = log (x+a) or f(x) = may need to be used instead where a is a constant sufficiently large so that x + a is positive for all the data elements. We now show how to use a log transformation via an example.
If we create a QQ Plot as described in Graphical Tests for Normality and Symmetry, we see that the data is not very normal (Figure 2). We now make a log transfer. We choose log base 10, although the result would be similar if we had chosen log base.