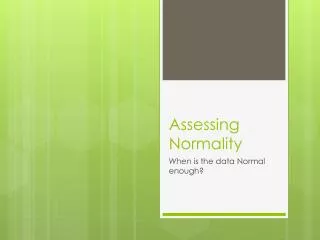
Assessing Normality
Assessing Normality. Are my data normally distributed?. Evidence for Normality. Mean and median should not be too different. Histogram or stem-and-leaf plot should look symmetric. Box plot should look symmetric. Normal probability plot should roughly be a straight line.

Assessing Normality
E N D
Presentation Transcript
Assessing Normality Are my data normally distributed?
Evidence for Normality • Mean and median should not be too different. • Histogram or stem-and-leaf plot should look symmetric. • Box plot should look symmetric. • Normal probability plot should roughly be a straight line.
Evidence against Normality • Mean and median are wildly different. • Histogram or stem-and-leaf plot look skewed. • Box plot should look skewed. • Normal probability plot does not follow a straight line.
There are several variations of normal probability plots. We will only use the MINITAB style. Percentile Data
Normal Probability Plot Interpretation skewed left normal skewed right
How to get one in Minitab? • Select Graph. • Select Probability Plot. • Select the desired variable. • Specify Normal in the Distribution box. • Select OK.