Download
1 / 7
70 likes | 189 Vues
This document provides a comprehensive overview of the SOIR exercises conducted by the Belgian Institute for Space Aeronomy. It includes data tools for orbit analysis, including tools for plotting occultation and constructing synthetic spectra. The exercises focus on retrieving specific measurements such as CO2, H2O, and HDO ratios across various altitudes and latitudes. Each exercise involves using the PlotOccultationPDS_0 tool and various orders to ensure accurate data overlap, as well as applying techniques to reconstruct synthetic spectra for accurate analysis.

E N D
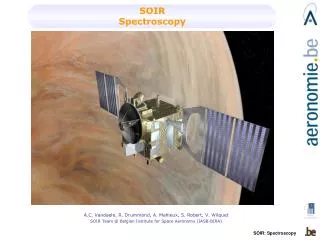
SOIRExercises A.C. Vandaele, R. Drummond, A. Mahieux, S. Robert, V. Wilquet SOIR Team @ Belgian Institute for Space Aeronomy (IASB-BIRA)
Overview • Data overview tool (Orbit_Order) • Plot Occultation tool (PlotOccultationPDS_0) • Synthetic spectrum construction
SOIR tools (1) • Exercise 1: Find two orbits, one close to the equator and one close to the pole, for which CO2 626 has been measured simultaneously in transition band • 21103-00001 (orders 141, 142, 143) – low altitude • 21102-00001 (orders 148, 149, 150) – mid altitude • 10011-00001 (orders 164, 165, 166) – high altitude • Exercise 2: Find orbits for which the HDO/H2O ratio can be calculated, i.e. H2O and HDO has been measured simultaneously. Check if the latitude dependence can be studied. • HDO: orders 119 to 124 • H2O: orders 167 to 172 Check if the altitude range overlap using the PlotOccultationPDS_0 tool.
SOIR tools (2) • Exercise 3: Find orbits for which the CO volume mixing ratio can be calculated simultaneously with the HCl volume mixing ratio, and who were measured between 60 and 80°N. • CO: orders 187 to 192 • HCl: orders 127 to 132 • CO2: orders 141 to 143 and 148 to 151 Check if the altitude range where the species absorb in each orbit overlap using the PlotOccultationPDS_0 tool. Check if the detector temperature was below 88 K.
Synthetic spectra construction (1) • Exercise 4: The CO2 main isotopologue 626 21102-00001 vibrational transition band absorbs in diffraction order 149. Using the precalculated absorption cross section (ACS) from file (under Matlab) or (CSV file), reconstruct the synthetic spectrum using 5 adjacent orders (147 to 152).
Synthetic spectra construction (2) • 4.1. Determine the wavenumber range in each order • 4.2. Calculate the ACS in each order • 4.3. Multiply by the blaze function in each order • 4.4. Multiply by the AOTF function in each order • 4.5. Convolve the spectrum • 4.6. Sum the orders • 4.7. Make the same operation with the denominator (ACS = 1) • 4.8. Perform the division • Data: • nCO2 = 1012 molec/cm3 • T = 200 K • p = 0.01 bar • Path length = 100 km • Instrument resolution = 0.15 cm-1 • Pixel to wavenumber relation