
Overview
Global population dynamics and climate change: Comparing species-level impacts on two contrasting large mammals Mark Hebblewhite 1* , Eric S. Post 2 , Steven W. Running 1 , Maosheng Zhao 1 1 University of Montana, 2 Pennsylvania State University.

Overview
E N D
Presentation Transcript
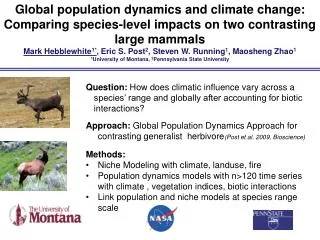
Global population dynamics and climate change: Comparing species-level impacts on two contrasting large mammals Mark Hebblewhite1*, Eric S. Post2, Steven W. Running1, Maosheng Zhao11University of Montana, 2Pennsylvania State University • Question: How does climatic influence vary across a species’ range and globally after accounting for biotic interactions? • Approach: Global Population Dynamics Approach for contrasting generalist herbivore(Post et al. 2009, Bioscience) • Methods: • Niche Modeling with climate, landuse, fire • Population dynamics models with n>120 time series with climate , vegetation indices, biotic interactions • Link population and niche models at species range scale
Overview • How do landuse and climatic change differentially affect the environmental niche of species throughout their ranges? • How does the strength of abiotic (climatic) factors vary across the range of an entire species distribution after accounting for biotic interactions (species interactions and resource dynamics)? • How does the spatial scale of population synchrony in Cervus vary with of climatic warming? • How do the influences of biotic and abiotic factors in dynamics vary spatially and temporally at a global scale?
Cervusand Rangifer ecology and life history Vors & Boyce et al. 2010
Cervusand Rangifer ecology and life history • Fig. 1. Correlation between population growth rate for Cervus and Rangifer populations and Northern Hemisphere temperature anomalies versus the strength of the local correlation between surface temperature and the North Atlantic Oscillation (NAO). The stronger the NAO-temperature correlation, the more local temperatures are affected by the NAO. This figure shows that the two genera will generally be affected in opposite directions by future warming. From Post et al. (2009).
Understanding Biotic & Abiotic Drivers of Population Dynamics Model Ungulate Population Growth Rate as a Function of Climate , Density, and Biotic Factors using Autoregressive State-Space Non-Linear Time-Series Models Nt= Nt-1exp(β0+ β1Xt-1 + Σωt-dCLIMt-d + et) (1) Xt= β0 + (1 + β1)Xt-1 + Σωt-dCLIMt-d + εt (2) Xt= β0 + (1 + β1)Xt-1 + Σωt-dCLIMt-d + rt-dWOLFt-dεt(3)
Understanding Biotic & Abiotic Drivers of Population Dynamics Fig. 4. Three-link trophic model for a wolf-ungulate-vegetation-climate system adapted from Post & Forchmammer (2001) where the coefficients of a time-series model of herbivore dynamics are expressed as a function of climate, vegetation and predator feedbacks. At right is an example time series for Banff National Park of wolves, elk, NDVI-index (from MODIS and AVHRR), and climate (North Pacific Oscillation).
Time-Series Modeling Fig. 3. Preliminary analyses showing the proportion of a subset of 94 Cervus spp. populations whose best-supported dynamics (using AICc) were described by linear density dependence (vs. “non-linear”) and responded to the NAO (“climate” vs. “no climate”).
Spatial Synchrony in Population Dynamics • Fig. 6. Map of hot spots of response to climate for Cervus(triangles) and Rangifer(circles) showing the strength of and magnitude (green – negative, red – positive) of the correlation with Northern Hemisphere temperature anomalies (NHTA) and population growth rate. The strength of the relationship between local temperature and a +1 standard deviation (SD) change in the North Atlantic Oscillation (NAO) is shown in the contour bands; a +10 correlation indicates a 1 degree Celsius change in local temperature with a +1 SD change in NAO. From Post et al. (2009).
Understanding NDVI-Forage relationships What does NDVI (& other VI’s) mean for Ungulate energetics? Key underlying driver of ungulate response to climate change Forage for ungulate is biomass, quantity and spatio-temporal variation Measure with combined ground-based remote plant cameras, plant forage sampling & remote sensing Idaho to Greenland latitudinal gradient Collaborators: Jeff Kerby (PSU), Greg McDermid (Uof Calgary)
An Ecological Hierarchy Senft et al. 1987
Alpine Grassland Migliavaccaet al. 2011
Progress Update Ungulate time-series acquisition (Hebblewhite, Post) Ungulate niche modeling for woodland caribou, data-acquisition for barrenground (Hebblewhite) NDVI/VI data acquisition for time-series (M. Zhao, Running) Forage-NDVI relationship sampling summer 2011 (Post, Hebblewhite)
TEAM: Tropical Ecosystem Assesment & Monitoring Network http://www.teamnetwork.org/
TEAM: Tropical Ecosystem Assesment & Monitoring Network http://www.teamnetwork.org/


