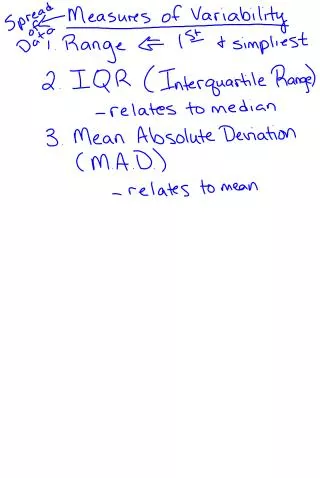
Correlation Analysis of RNA-seq Data Under Zinc and Cadmium Treatments
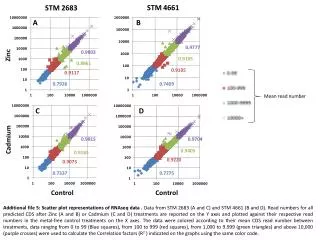
This study presents scatter plot representations of RNA-seq data from STM 2683 and STM 4661 under zinc and cadmium treatments. Read numbers for all predicted coding sequences (CDS) post-treatment are plotted on the Y-axes against their respective control treatment read numbers on the X-axes. Data points are color-coded based on mean CDS read numbers: blue squares (0-99), red squares (100-999), green triangles (1,000-9,999), and purple crosses (above 10,000). Correlation factors (R²) are calculated and indicated on the plots using the corresponding color codes.

Correlation Analysis of RNA-seq Data Under Zinc and Cadmium Treatments
E N D
Presentation Transcript
Mean read number Additional file 5: Scatter plot representations of RNAseq data . Datafrom STM 2683 (A and C) and STM 4661 (B and D). Read numbers for all predicted CDS after Zinc (A and B) or Cadmium (C and D) treatments are reported on the Y axes and plotted against their respective read numbers in the metal-free control treatments on the X axes. The data were colored according to their mean CDS read number between treatments, data ranging from 0 to 99 (Blue squares), from 100 to 999 (red squares), from 1,000 to 9,999 (green triangles) and above 10,000 (purple crosses) were used to calculate the Correlation factors (R2 ) indicated on the graphs using the same color code.