Download
1 / 27
270 likes | 406 Vues
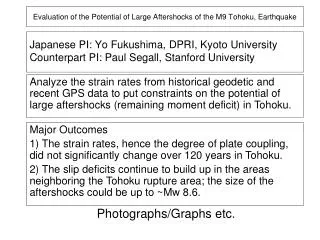
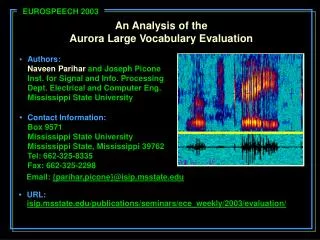
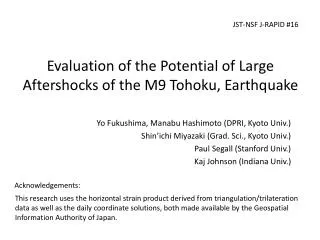
JST-NSF J-RAPID #16. Evaluation of the Potential of Large Aftershocks of the M9 Tohoku, Earthquake. Yo Fukushima, Manabu Hashimoto (DPRI, Kyoto Univ.) Shin’ichi Miyazaki (Grad. Sci., Kyoto Univ.) Paul Segall (Stanford Univ.) Kaj Johnson (Indiana Univ.). Acknowledgements:.

E N D
JST-NSF J-RAPID #16 Evaluation of the Potential of Large Aftershocks of the M9 Tohoku, Earthquake Yo Fukushima, Manabu Hashimoto (DPRI, Kyoto Univ.) Shin’ichi Miyazaki (Grad. Sci., Kyoto Univ.) Paul Segall (Stanford Univ.) Kaj Johnson (Indiana Univ.) Acknowledgements: This research uses the horizontal strain product derived from triangulation/trilateration data as well as the daily coordinate solutions, both made available by the Geospatial Information Authority of Japan.
Large EQs after megathrust events Sumatra-Andaman EQ Dec. 2004 Mw 9.1 Nias Possible Mw 8.8 after Pollitz et al. (2006) Nias EQ Mar. 2005 Mw8.6 Ammon et al. (2005)
Basic Idea • An EQ can trigger other EQs in the neighbor. • This is possible IF stress (hence slip deficit) in the neighboring region has already been built up. Plate subduction 8-9 cm/year Slip Examine the slip deficit on the fault to estimate the potential of future earthquakes. Steady slip Slip deficit EQ EQ EQ Time
Our Questions on Tohoku • How has slip deficit been built up over years? Are historical geodetic and recent GPS data consistent? • How do the slip deficit rate and slip compare? • What is the spatial distribution of the slip deficits as of today?
1: Analysis of horizontal strain rate of recent 120 years in Eastern Japan • Dataset #1: Horizontal strain rate derived from triangulation/trilateration surveys (1890s – 1980s) • Dataset #2: Horizontal strain rate derived from GPS displacements (2000 - 2004) • We compare a shear strain component (ϒ1) to avoid errors originated from baseline measurements.
Strain rate from GEONET 1997-2001 (Miura et al 2004) Strain rateGSI:100 years1883-1994 http://www.gsi.go.jp/cais/HIZUMI-hizumi.html
2 Since ε11 >> ε22, ϒ1 ≈ ε11. ϒ1 is useful to evaluate the slip deficit between the subducting Pacific plate and the overriding plate. γ1 1
Data Processing • Triangulation/trilateration: For each triangle, calculate the ϒ1 rate by conversion from the lengths and directions of the principal strains and tensor rotation. • GPS: Obtain the (constant) velocities from daily coordinate solutions (GSI’s F3 solution), interpolate the velocities to triangulation points, and compute the ϒ1 rate.
Comparison of ϒ1rate 三角・三辺 GPS Triang./Trilat. GPS Both show ϒ1<0 (≈EW contraction) 1923 Kanto EQ
Corrections for the EQs that occurred in the triang./trilat. period (Only the coseismic fault models were taken into account.) Mw 7.6 1983 Mw 8.3 1968 Mw 7.5 1964 Mw 7.7 1978 Mw 8.0 1938
Before correction After correction
Conclusion from Part 1: The degree of coupling did not significantly change in the recent 120 years. Triang./ Trilat. GPS γ1 ≈ -9.0 x 10⁻⁸/yr γ1 ≈ -7.4 x 10⁻⁸/yr
2: Slip deficit rates, coseismic+postseismic slips from GPS displ. • Pre-seismic (1996-2011): Obtain the constant velocity components at each station, by removing seasonal variations etc. • Co- and post-seismic (2011-2013/2/8): Measure the displacement offsets. Displ. Postseismic Coseismic Pre-seis. velocity Time
Preseismic rate (1996-2011/3) Postseismic (2011/3-2013/2) Coseismic (2011.3.11)
Analysis Method • Mesh the plate interface with triangles • Solve for the distribution of slip deficits (pre-seismic) and slip (co- and post-seismic) on the mesh. • Slip (deficit) is assumed to be in the plate convergence direction. • Least-squares inversion with smoothing constraint. The weight of the smoothing is determined by the ABIC.
Slip deficit rate Goodness of fit (horiz.) (cm/year) White: Little resolution
Coseismic slip Goodness of fit (horiz.) (m)
Postseismic slip Goodness of fit (horiz.) (m)
The Slip Deficit Coseis. + postseis. slip (released slip deficit) of Tohoku EQ Cumulative slip deficit in 300yrs - =? Slip deficit in meters From the analysis of the triang./trilat. data, we can extrapolate the slip deficit rate back in time…
Residual in Slip Deficit (Known high potential area) Two patches of large slip deficit in the neighbor of Tohoku EQ patch: Needs further check for reliability “1968 Tokachi-oki patch” Mw 8.5 “1938 Shioyazaki-oki patch” + “Ibaraki-oki patch” (+ “1677 Tsunami-EQ patch?”) Mw 8.6 (m) Boso-oki Mw 8.5 Responsible for 1953 M7.4, 1909 M7.7? Interface PAC-PHS
Importance of viscoelasticity The estimations of slip deficit and afterslips could be much different when viscoelastic deformation is taken into account. Afterslip in 50 days with viscoelasticity taken into account
Summary • How has slip deficit been built up over years? Are historical geodetic and recent GPS data consistent? • How do the slip deficit rate and slip compare? • What is the spatial distribution of the slip deficits as of today? A. Triang./trilat. horizontal strain ≈ GPS horizontal strain. A. Area of large slip of Tohoku EQ had large slip deficit rates. A. The slip deficits continue to build up in the surrounding region of the Tohoku rupture area. To answer this question in more concrete manner, it is important to take into account the slip history associated with previous events in each area.