Download
1 / 27
270 likes | 388 Vues
Explore the intricate neural code language of single cells, deciphering elemental symbols using spike-triggered averages and stochastic processes. Analyze Poisson and renewal processes, Poisson model approximations, Fano factor, CV analysis, ISI distribution, and covariance in neural computation. Discover how models like the integrate-and-fire neuron and spike response aids in predicting firing rates. Unveil the significance of stimulus features and functional models in neural function analysis with weak points and solutions. Delve into decision functions, reverse correlation, dimensionality reduction, and covariance in understanding neuronal operations.

E N D
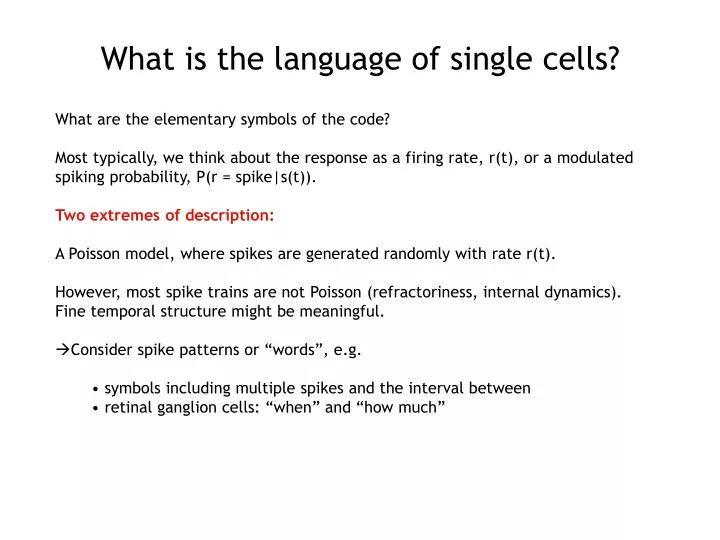
What is the language of single cells? • What are the elementary symbols of the code? • Most typically, we think about the response as a firing rate, r(t), or a modulated • spiking probability, P(r = spike|s(t)). • Two extremes of description: • A Poisson model, where spikes are generated randomly with rate r(t). • However, most spike trains are not Poisson (refractoriness, internal dynamics). Fine temporal structure might be meaningful. • Consider spike patterns or “words”, e.g. • symbols including multiple spikes and the interval between • retinal ganglion cells: “when” and “how much”
Multiple spike symbols from the fly motion sensitive neuron Spike Triggered Average 2-Spike Triggered Average (10 ms separation) 2-Spike Triggered Average (5 ms)
Spike statistics Stochastic process that generates a sequence of events: point process Probability of an event at time t depends only on preceding event: renewal process All events are statistically independent: Poisson process Poisson: r(t) = r independent of time, probability to see a spike only depends on the time you watch. PT[n] = (rT)n exp(-rT)/n! Exercise: the mean of this distribution is rT the variance of this distribution is also rT. The Fano factor = variance/mean = 1 for Poisson processes. The Cv = coefficient of variation = STD/mean = 1 for Poisson Interspike interval distribution P(T) = r exp(-rT)
The Poisson model (homogeneous) Probability of n spikes in time T as function of (rate T) Poisson approaches Gaussian for large rT (here = 10)
How good is the Poisson model? Fano Factor A B Area MT Data fit to: variance = A meanB Fano factor
How good is the Poisson model? ISI analysis ISI distribution generated from a Poisson model with a Gaussian refractory period ISI Distribution from an area MT Neuron
How good is the Poisson Model? CV analysis Poisson Coefficients of Variation for a set of V1 and MT Neurons Poisson with ref. period
spike-triggering stimulus feature decision function Decompose the neural computation into a linear stage and a nonlinear stage. stimulus X(t) f1 spike output Y(t) x1 P(spike|x1 ) x1 To what feature in the stimulus is the system sensitive? Gerstner, spike response model; Aguera y Arcas et al. 2001, 2003; Keat et al., 2001 Modeling spike generation Given a stimulus, when will the system spike? Simple example: the integrate-and-fire neuron
Want to solve for K. Multiply by s(t-t’) and integrate over t: Note that we have produced terms which are simply correlation functions: Given a convolution, Fourier transform: Now we have a straightforward algebraic equation for K(w): Solving for K(t), Predicting the firing rate Let’s start with a rate response, r(t) and a stimulus, s(t). The optimal linear estimator is closest to satisfying
Going back to: Predicting the firing rate For white noise, the correlation function Css(t) = s2 d(t), So K(t) is simply Crs(t).
spike-triggering stimulus feature decision function stimulus X(t) f1 spike output Y(t) x1 P(spike|x1 ) x1 Modeling spike generation The decision function is P(spike|x1). Derive from data using Bayes’ theorem: P(spike|x1) = P(spike) P(x1 | spike) / P(x1) P(x1) is the prior : the distribution of all projections onto f1 P(x1 | spike) is the spike-conditional ensemble : the distribution of all projections onto f1 given there has been a spike P(spike) is proportional to the mean firing rate
Models of neural function spike-triggering stimulus feature decision function stimulus X(t) f1 spike output Y(t) x1 P(spike|x1 ) x1 Weaknesses
covariance Reverse correlation: a geometric view Gaussian prior stimulus distribution STA Spike-conditional distribution
Cij = < S(t – ti) S(t - tj)> - < STA(t - ti) STA (t - tj)> - < I(t - ti) I(t - tj)> Dimensionality reduction The covariance matrix is simply Stimulus prior • Properties: • If the computation is low-dimensional, there will be a few eigenvalues • significantly different from zero • The number of eigenvalues is the relevant dimensionality • The corresponding eigenvectors span the subspace of the relevant features Bialek et al., 1997
Functional models of neural function spike-triggering stimulus feature decision function stimulus X(t) f1 spike output Y(t) x1 P(spike|x1 ) x1
Functional models of neural function spike-triggering stimulus features f1 multidimensional decision function x1 stimulus X(t) f2 spike output Y(t) x2 f3 x3
Functional models of neural function ? ? ? spike-triggering stimulus features f1 multidimensional decision function x1 stimulus X(t) f2 spike output Y(t) x2 f3 x3 spike history feedback
Covariance analysis Let’s develop some intuition for how this works: the Keat model Keat, Reinagel, Reid and Meister, Predicting every spike. Neuron (2001) • Spiking is controlled by a single filter • Spikes happen generally on an upward threshold crossing of • the filtered stimulus • expect 2 modes, the filter F(t) and its time derivative F’(t)
Covariance analysis Let’s try some real neurons: rat somatosensory cortex (Ras Petersen, Mathew Diamond, SISSA: SfN 2003). Record from single units in barrel cortex
Normalisedvelocity Pre-spike time (ms) Covariance analysis Spike-triggered average:
Covariance analysis Is the neuron simply not very responsive to a white noise stimulus?
Covariance analysis Prior Spike- triggered Difference
0.4 0.3 0.2 0.1 Velocity 0 -0.1 -0.2 -0.3 -0.4 150 100 50 0 Pre-spike time (ms) Covariance analysis Eigenspectrum Leading modes
Covariance analysis Input/output relations wrt first two filters, alone: and in quadrature:
0.4 0.3 0.2 Velocity (arbitrary units) 0.1 0 -0.1 -0.2 -0.3 150 100 50 0 Pre-spike time (ms) Covariance analysis How about the other modes? Pair with -ve eigenvalues Next pair with +ve eigenvalues
Covariance analysis Input/output relations for negative pair Firing rate decreases with increasing projection: suppressive modes (Simoncelli et al.)