Download
1 / 35
350 likes | 516 Vues
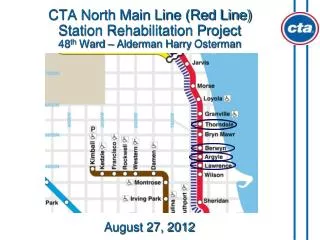
PSAE REPORT Zion-Benton Twp. H.S. District 126 Dr. Chris Clark, Superintendent August 27, 2012 with significant contributions from Dan Sullivan, Data Analyst. PSAE 2012 Requirements. Reauthorization of NCLB still being debated by Congress.

E N D
PSAE REPORT Zion-Benton Twp. H.S. District 126 Dr. Chris Clark, Superintendent August 27, 2012 with significant contributions from Dan Sullivan, Data Analyst
PSAE 2012 Requirements • Reauthorization of NCLB still being debated by Congress. • The Federal government established a state waiver process. Illinois’ waiver is still pending. • Total percentage of students required to meet standards was held to 85.0%. • Graduation Rate requirement held to 82.0%. • Implementation of national graduation formula had significant negative impact. BUT, our graduation rate increased 5.2% from 74.3% to 79.5% this year!
What do we know about the Class of 2013 who took the PSAE in April 2012? • They were the first cohort to have matriculated through the first-year rollout of each level of the new CRS aligned curriculum. • This spring’s testing cohort included students who did not qualify to test as juniors by having a minimum of 14 credits. • This spring’s testing cohort also included ALL sixth semester juniors, regardless of credit status. Previously, students needed 14 credits to test. • Therefore, in order to compare “apples to apples” in an effort to understand our progress, we must drill down and disaggregate the data further.
Growth Expectations from 8th Grade Explore to Junior ACT GEM: Growth Equivalence Measure = Difference between the students’ two assessments scores divided by the first assessment score.
-0.35 -0.90 *“All” students changed to include seniors who were not eligible to test as juniors. ** “All” students now includes all 6th semester students regardless of credits.
-0.26 -0.20 *“All” students changed to include seniors who were not eligible to test as juniors. ** “All” students now includes all 6th semester students regardless of credits.
The Impact of Including All Previously Non-Tested Seniors and All 6th Semester Juniors is Evident *“All” students changed to include seniors who were not eligible to test as juniors. ** “All” students now includes all 6th semester students regardless of credits.
Final PSAE Results In spite of the steady increase in growth from EXPLORE to ACT demonstrated by our cohorts over time, the percentage of students meeting standards decreased in 2012 due to the inclusion of all previously non-tested students and all 6th semester juniors: • 34.4% Students Met Reading Standards; Down 6.5% • 31.7% Students Met Math Standards; Down 0.4%
Now let’s take a look at just the 6th semester juniors, without the seniors who did not test last year. . .
The Class of 2013 8th grade EXPLORE scores were below 2012’s. EXPLORE CRS Benchmarks English = 13 Math = 17 Reading = 15 Science = 20 Class of 2013 EXPLORE averages were lower due to the inclusion of all 6th semester juniors. *Includes all Juniors regardless of credits.
ACT CRS Benchmarks English = 18 Math = 22 Reading = 21 Science = 24 Class of 2013 ACT averages are lower due to the inclusion of all 6th semester juniors. *Includes all Juniors regardless of credits.
The Class of 2013 EXPLORE to ACT Growth But, the Class of 2013 EXPLORE to ACT Growth (GEM) improved in spite of including all juniors! But let’s look at growth instead of attainment! *Includes all Juniors regardless of credits.
Now let’s compare “apples to apples” by looking only at those students meeting the same criteria for inclusion in the cohort comparison analysis, i.e. 14-credit juniors . . .
The Class of 2013 ACT STATE (14 Credits) ACT CRS Benchmarks English = 18 Math = 22 Reading = 21 Science = 24 Class of 2013 juniors who met 14 credits significantly outpaced prior cohorts who met similar criteria. First time exceeded an average of 20 in four areas! *Includes only Juniors who earned 14 credits.
The Class of 2013 EXPLORE to ACT GEM (14 Credits) Class of 2013 juniors who met 14 credits significantly outpaced prior cohorts who met similar criteria. *Includes only Juniors who earned 14 credits.
The Class of 2013 EXPLORE to ACT GEM (14 Credits) Class of 2013 juniors who met 14 credits surpassed the CRS growth goals for Reading and Math and made significant gains in Math and Science! *Includes only Juniors who earned 14 credits.
MATCHED COHORT ANALYSIS(Those with 14 credits.) • Highest average mean ACT scores in 4 of 5 areas in the past 7 years. • Highest growth ever from EXPLORE to ACT in all 5 areas. • English reflects a 6.3 point growth from EXPLORE to ACT; the highest growth ever. • Reading has exceeded a 5.0 point growth (5.07), highest growth ever. • Math made a huge gain of 1.85 to reach 4.86 point growth, highest growth ever. • Science jumped 1.04 to 3.55, highest growth ever. • Our Composite growth jumped 1.01 to 4.91.
The following charts are matched students only (EXPLORE to ACT State), ±450 students including the juniors with less than 14 credits. Let’s take a look at a score band analysis of their performance.
In English, we now have an overall growth of 5.48 points and a GEM of .40. (Over 6 points for those with 14 credits). A slightly higher percentage of students are at the college readiness benchmark. The frequency distribution on the ACT is fairly balanced with just a slight indication of higher performing students taking a bigger jump. About a third as many students are scoring 12 or below on ACT vs. EXPLORE. More than half are now 20 or higher.
Reading data mirrors that of English. The number of students 12 or below dropped from 34% to 16%, but 16% is still a concern. For the ACT (unmatched) we have a peak of 10% scoring 15, below the mean of 17.77% The growth comes disproportionately from the upper half of the students. Where we had less than 1% scoring 20 or higher, we now have 41% scoring 20 or higher. There has been movement for all levels and an average growth of over 4.5 points.
In Math, there is evidence of growth at all levels. On EXPLORE only about 4% scored higher than 19. Now 40% score higher than 19, and we also . We also now have about 18% scoring 24 or higher. Those 12 or below have dropped from 24% to 1%. The regular pathway averaged over 3% growth and the Honors/AP pathway grew over 6 points. So the growth is not even, but the percentage growth (GEM) does smooth out that disparity.
Science is the only subject where the number of students 12 or below increased, yet the number scoring 15 or below was nearly cut in half. Those scoring 20 or higher jumped from only 12% to about 48%. So gains were significant, but a small number of students who are behind apparently fell even further behind.
Our composite scores show that students in the 12 or below band dropped from 22% to 4%. 75% now score 16 or higher. There is a bit of a stretching of the frequency curve to the right – further indication that our upper pathway students are making gains that surpass their peers. But a 4.36% gain and a GEM of .29 is the highest growth of any class over the last seven years.
Class of 2013 Growth By Pathway There is a trend where growth between EXPLORE and PLAN seems balanced across pathways, but that balance does not carry over to the P-ACT and now the ACT. The implications are that our less prepared students fall off pace from their more proficient peers.
Where We Should Be Encouraged • ACT Scores are what colleges utilize when selecting students and awarding scholarships. Ours have been climbing, and we are posting the highest ACT scores ever for students maintaining appropriate credit status. • Our data informs us that our new ACT College Readiness Standards aligned curriculum is yielding positive results. • More students, particularly students of color, are taking AP coursework. The last two year’s of AP data show an increase in tests taken and a significant improvement in percentage of students earning a 3 or higher. The College Board has recognized District 126 for its accomplishments.
Class of 2013 Growth by Ethnicity As a rule our African-American and Hispanic students are a bit behind our white and Asian/Pacific Islanders in growth. The gap between races is not as pronounced as the differences by pathway and is smaller that prior to the implementation of the new CRS curriculum.
AP TREND DATA *First year opt out of AP Exam allowed.
ACT TREND DATA The Class of 2012 is the last cohort to matriculate through the old curriculum model. ACT has not yet released Class of 2013 data. This will become available next summer.
Research supports that the freshman year is the most critical year in determining high school success. Three years in, let’s take a look at how are freshman cohorts have been performing under the new curriculum . . .
TechAc Goal Regular Advance Honors Instruct Int. Lang. ALL English 2.48 2.48 2.09 3.06 0.71 2.43* 2.52 2.0 Reading 2.21 1.78 1.74 1.90 5.00 2.55* 1.91 2.0 Science 1.87 1.07 0.61 0.83 1.13 n/a 1.26 1.0 Comp 2.02 1.74 1.29 2.32 2.14 n/a 1.83 1.75 Alg1 GeoHon MathAcad Alg 1 Adv Geom Goal ALL Instruct 1.42 2.66** 1.51 2.0 Math 0.46 2.34 5.54 0.65 Class of 2013 Freshman EXPLORE to PLAN Growth (April 2010) Data indicated that our new integrated, standards aligned curriculum model yielded very positive results for our first cohort of freshmen. And, the growth was fairly consistent across all levels. Some of our highest growth occurred for those students enrolled in our freshman intervention courses. *Freshmen taking Interactive Language Skills reading intervention course. **Freshmen taking Math Academy intervention course in addition to Algebra I.
TechAc Goal Regular Advance Honors Instruct Int. Lang. ALL English 2.54 2.64 NA 2.00 1.82 2.40* 2.43 2.0 Reading 1.93 1.83 NA 2.29 0.60 2.50* 1.88 2.0 Science 1.39 0.51 NA 2.27 3.36 1.10 1.08 1.0 Comp 1.89 1.64 NA 2.57 2.00 1.96 1.87 1.75 Alg1 GeoHon MathAcad Alg 1 Adv Geom Goal ALL Instruct 1.89 3.81** 2.01 2.0 Math 0.58 3.58 2.94 Class of 2014 Freshman EXPLORE to PLAN Growth (April 2011) For the second year, data indicated that our new integrated, standards aligned curriculum model continued to deliver very positive results for our freshman students. *Freshmen taking Interactive Language Skills reading intervention course. **Freshmen taking Math Academy intervention course in addition to Algebra I.
TechAc Goal Regular Advance Honors Instruct Int. Lang. ALL English 2.96 2.64 NA 2.56 2.40 2.19* 2.55 2.0 Reading 2.38 2.16 NA 2.11 2.83 2.88* 2.08 2.0 Science 2.37 1.81 NA 2.53 1.00 1.91 2.06 1.0 Comp 2.24 1.80 NA 3.12 3.14 2.33 2.02 1.75 Alg1 GeoHon MathAcad Alg 1 Adv Geom Goal ALL Instruct 1.26 2.35** 1.40 2.0 Math 0.60 2.58 2.34 Class of 2015 Freshman EXPLORE to PLAN Growth (April 2012) Our third year posted the highest “ALL” growth scores to date. *Freshmen taking Interactive Language Skills reading intervention course. **Freshmen taking Math Academy intervention course in addition to Algebra I.
In Summary • We celebrate the many demonstrated gains in our ACT scores posted by those students who are track as freshman and stay with us. • Of concern is the large percentage of students who require interventions. • Improvement of literacy skills across all content areas is necessary/critical. Staff development is planned for 2012-13 to address this need and to assist with refining our new curriculum to align to the Common Core Standards. • Embrace the importance of being data informed. Develop and utilize appropriate formative assessments and take advantage of utilizing Mastery Manager to warehouse and analyze your data. • Remember…the deadline for incorporating the new state requirement of including student growth measurements into the teacher’s summative evaluation is nearing. Indeed, student growth measurements have been added to the principal and assistant principals’ evaluation this year. • Sharpen your skills regarding assessments, data management, and data analysis. Utilize these skills to differentiate your instruction and your students will benefit as a result. • Take advantage of the extensive expertise of your colleagues – Peer Coaching.
A Word of Congratulations from Dr. Venegoni “I am impressed, although not surprised . . . the report is consistent with my expectations and testifies unambiguously to the overwhelmingly positive effect that ZB's curricular work has had on student achievement. The state's incapacity to evaluate data accurately aside (a big problem for all of us), ZB's actual improvement cannot be denied. The nearly two point gain since 2007 for "apples to apples" students is enormous and is by any standard stellar growth. Your increased percentage of students with higher scores and highly significantly decreased percentage of students with lower scores also offers incontrovertible evidence of the success of ZB's transformation. Finally, the increases in GEM scores validates my assertion that ZB has moved from the top of the lower quintile of observed performance to the lower end of the highest quintile, or top of the second quintile. In layman's language, ZB has grown from a 2 to a 7.5 or 8 on a 1-10 scale (10 highest).”