GIS in Marine and Coastal Environments I-IV
GIS in Marine and Coastal Environments I-IV. AAG Centennial Meeting, Philadelphia March 17, 2004. A New Object-Oriented Data Model for Oceans, Coasts, Seas, and Lakes. Dawn Wright, Oregon State University Pat Halpin, Duke University Michael Blongewicz, DHI Joe Breman and Steve Grisé, ESRI.

GIS in Marine and Coastal Environments I-IV
E N D
Presentation Transcript
GIS in Marine and Coastal Environments I-IV AAG Centennial Meeting, Philadelphia March 17, 2004
A New Object-Oriented Data Model for Oceans, Coasts, Seas, and Lakes Dawn Wright, Oregon State University Pat Halpin, Duke University Michael Blongewicz, DHI Joe Breman and Steve Grisé, ESRI AAG Centennial Meeting, Philadelphia March 17, 2004 dusk.geo.orst.edu/djl/arcgis
ArcGIS “Custom” Data Models • Basemap • Administrative Boundaries • Utilities • Parcels • Transportation • Imagery etc ... • Conservation/Biodiv • Hydro • Groundwater Hydro • Forestry • Geology • Petroleum • Marine • IHO-S57 • Atmospheric etc ...
Marine Data Collection Image courtesy of PISCO, OrSt
A Georelational to a Geodatabase Model • coverage and shapefile data structures • homogenous collections of points, lines, and polygons with generic, 1- and 2-dimensional "behavior" • can’t distinguish behaviors • Point for a marker buoy, same as point for OBS • “smart features” in a geodatabase • lighthouse must be on land, marine mammal siting must be in ocean
Purpose of Marine Data Model • basic template for implementing GIS projects • input, formatting, geoprocessing, creating maps, performing analyses • basic framework for writing program code and maintaining applications • development of tools for the community • promote networking and data sharing through established standards
Project Data Model Project Data Model Project Data Model Design Strategy “Generic” Marine Data Model Inheritance User Group Data Model User Group Data Model User Group Data Model
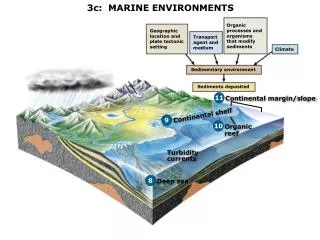
Steps in Data Modeling (1) Model the user's view of data • what are the basic features needed to solve the problem? (2) Select the geographic representation • points, lines, areas, rasters, TINs Bathymetry Sidescan sonar/Backscatter Shoreline Marine boundaries (e.g., MPAs) Geophysicaltime series Sub-bottom profiling Magnetics Gravity Seismics Sediment transport etc. ... Marine mammal movement Atmospheric influences Sea state Wave activity Sea surface temperature Salinity Sensorcalibration data Current meters Density etc. ... Image by Joe Breman, ESRI
Users’s View of Data Steve Grisé, ESRI
Steps in Data Modeling (cont.) (3) Define objects and relationships • draw a UML diagram (4) Match to geodatabase elements • specify relationships, “behaviors” (5) Organize geodatabase structure
Measurement InstantaneousPoints MeasuringDevice MeasuredType MeasuredData InstantaneousPoint (ex: CTD) Michael Blongewicz X TimeStamp Y Measurement MeasuringDevice Z
Image courtesy of the Neptune Project, www.neptune.washington.edu, University of Washington Center for Environmental Visualization
Measurement TimeDurationPoints TSType TimeSeriesTurnTable TimeSeries3 TimeSeries2 TimeSeries1 TimeDurationPoint (ex: moored ADCP) Michael Blongewicz Z Measurement X Y
TimeSeriesPoints TimeSeriesTurnTable TimeSeries3 TimeSeries2 TimeSeries1 TimeSeriesPoints (ex: ADCP in series) Michael Blongewicz X Y Z TSType
Implications (1) • Inputting & Formatting Data • Provides common data structures • Allows control of required data fields from collection through analysis phases
Implications (2) • Geoprocessing & Analysis • Allows explicit spatial & temporal relationships to be used in geoprocessing and analysis
Statistical Applications GIS Applications GIS Applications Build Better Models / Analysis Data Space Geographic Space Geographic Space 2. Statistical methods Redefine Model Model Habitat 4. Model validation Sample Data 1. Sampling 3. GIS models
vector data raster data metadata map Data Type: Z39.50 FGDC Tools/Protocols: XML DODS WMS Implications (3) • Data Sharing • Within / Between Projects • Internet Map Services(Geography Network, NSDI, OBIS…) • Internet Map Services: data conflation tools Distributed Generic Information Retrieval Distributed Oceanographic Data System Web Mapping Services
Project is Ongoing • Case studies , tool development • Interested participants via web site ~275 people, 31 countries • Refine UML - abstract and feature classes, descriptions, rules/behaviors • 2004 ESRI UC sessions • 2005 ESRI Press book • Agency “buy-in” • Publicizing and publishing • Tie-in w/ other model efforts
More information dusk.geo.orst.edu/djl/arcgis inc. downloads, join MDM listserv Next talk and… 5236. Thursday, 10 a.m., Alyssa Aaby, Salon D