Data-Driven Instruction
Data-Driven Instruction. Coaches Presentation 9-13-13 Presentation based on the work of Paul Bambrick - Santoyo -Driven by Data. Ground rules for our PD. Technology can be used to participate or take notes. Participation is expected by all.

Data-Driven Instruction
E N D
Presentation Transcript
Data-Driven Instruction Coaches Presentation 9-13-13 Presentation based on the work of Paul Bambrick-Santoyo-Driven by Data
Ground rules for our PD • Technology can be used to participate or take notes. • Participation is expected by all. • If the activities are not meaningful to your work, then let us know so we can adjust for future meetings. • To be efficient in bringing back the conversation, when I raise my hand, please finish the conversation and raise your hand. • I will use ‘cold call’ throughout the presentation to seek responses. If you have other ground rules that you would like to add, please write them on a sticky note and give them to me at the end of the meeting.
Goals for this session… • By the end of this session, you should be able to: • Identify the 4 critical components of DDI • Understand the connection between assessment, analysis, and action • Lead an individual data analysis meeting • Make connections between DDI and Colonial initiatives
Leverage Leadership Plans in colonial What’s been done? • Participation of staff in a variety of workshops led by Paul Bambrick since January 2013 • Adjustment to Colonial calendar to include multiple opportunities for data analysis in 2013-2014 • Revamping K-8 ELA and Math Common Assessments • Training for administrators on DDI beginning last Spring on DDI • Overview for new teachers in August 2013 • Training for administrators on Observation/Feedback in September 2013
Leverage Leadership Plans in colonial What’s to come? • Training for coaches on DDI and then Observation/Feedback • Continued training for administrators in a differentiated model on DDI and Observation/Feedback • Training for schools on DDI and Observation/Feedback
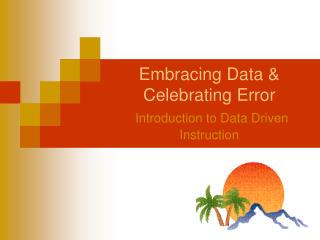
What does it mean to be Data-Driven?Text 653780 and response to 37607
What does it mean to be Data-Driven? “Data-driven instruction is the philosophy that schools should constantly focus on one simple question: ARE OUR STUDENTS LEARNING? Using data-based methods, these schools break from the traditional emphasis on what teachers ostensibly taught in favor of a clear-eyed, fact-based focus on what students actually learned.” -Paul Bambrick in Driven by Data
NY State Public School ELA 4th Performance vs. Free-Reduced Rates 100% 90% 80% 70% Pct. Proficient 60% 50% 40% 30% 20% 10% 10% 20% 30% 40% 50% 60% 70% 80% 90% 100% Pct. Free-Reduced Lunch
NY State Public School ELA 4th Performance vs. Free-Reduced Rates 100% 90% 80% 70% Pct. Proficient 60% 50% 40% 30% 20% 10% 10% 20% 30% 40% 50% 60% 70% 80% 90% 100% Pct. Free-Reduced Lunch
Focus on the most effective, efficient level in improving student achievement in our schools: data-driven instruction
How does this connect to what we are already doing in Colonial? PLC’s • What do you want students to know? • How will you know if they know it? • What will you do if they don’t learn it? • What will you do if they do?
4 Critical Components to DDI • Assessment • Analysis • Action • Culture
4 Critical Components to DDI • Assessment-Create Rigorous interim assessments that provide meaningful data • Analysis-Examine the results of assessments to identify the causes of both strengths and shortcomings. • Action-Teach effectively what students most need to learn. • Culture-Create an environment in which data-driven instruction can survive and thrive.
Assessment Create Rigorous interim assessments that provide meaningful data CORE IDEAS: • Standards are meaningless until you define how you will assess them. • When you define how you’ll assess a standard, you are defining your expectations.
1. 50% of 20: 2. 67% of 81: 3. Shawn got 7 correct answers out of 10 possible answers on his science test. What percent of questions did he get correct? 4. J.J. Redick was on pace to set an NCAA record in career free throw percentage. Leading into the NCAA tournament in 2004, he made 97 of 104 free throw attempts. What percentage of free throws did he make? 5. J.J. Redick was on pace to set an NCAA record in career free throw percentage. Leading into the NCAA tournament in 2004, he made 97 of 104 free throw attempts. In the first tournament game, Redick missed his first five free throws. How far did his percentage drop from before the tournament game to right after missing those free throws? 6. J.J. Redick and Chris Paul were competing for the best free-throw shooting percentage. Redick made 94% of his first 103 shots, while Paul made 47 out of 51 shots. • Which one had a better shooting percentage? • In the next game, Redick made only 2 of 10 shots while Paul made 7 of 10 shots. What are their new overall shooting percentages? Who is the better shooter? • Jason argued that if Paul and J.J. each made the next ten shots, their shooting percentages would go up the same amount. Is this true? Why or why not?
ASSESSMENT CORE IDEAS: • Standards (and objectives) are meaningless until you define how to assess them. • Because of this, assessments are the starting point for instruction, not the end.
LITTLE RED RIDING HOOD: 1. What is the main idea? 2. This story is mostly about: A. Two boys fighting B. A girl playing in the woods C. Little Red Riding Hood’s adventures with a wolf D. A wolf in the forest 3. This story is mostly about: A. Little Red Riding Hood’s journey through the woods B. The pain of losing your grandmother C. Everything is not always what it seems D. Fear of wolves
ASSESSMENT CORE IDEAS: • In an open-ended question, the rubric defines the rigor. • In a multiple choice question, the options define the rigor.
Begin with the end in mind! • A teacher’s instruction must align not only with the level of the standards that are being taught, it must also align with the types of tasks/questions that are on the assessment.
Analysis Examine the results of assessments to identify the causes of both strengths and shortcomings.
Man on Fire What were the key moments in Creasy’sattempt to help the girl (Pita)? What made Creasy’sanalysis effective?
Man on Fire What were the key moments in Creasy’sattempt to help the girl (Pita)? What made Creasy’sanalysis effective?
CORE IDEAS • If you’re not at the pool, you cannot do the analysis. • The heart of the matter is presenting the data so clearly that the student or teacher can come to the right conclusion on their own.
Now it’s your turn! • Each table has been given a data set from an assessment. • Data sheet contains: • Top row: Number of assessment question • Next row: Standard • Columns: • Student Names, % correct by question type • Blank space-student answered correctly • Letter-wrong letter choice • Number-points earned • Bottom-Overall performance by Standards
Now it’s your turn! • Each table has been given a data set from an assessment. • Take 4 minutes to look at the data individually. Using the ‘Global Impressions’ section, take notes on your graphic organizer.
Global Impressions • Part 1: Global conclusions you can draw from the data: • How well did the class do as a whole? • What are the strengths and weaknesses in the standards: where do we need to work the most? • How did the class do on old vs. new standards? Are they forgetting or improving on old material? • How were the results in the different question types (multiple choice vs. open-ended, reading vs. writing)? • Who are the strong/weak students?
Now it’s your turn! • Each table has been given a data set from an assessment. • Take 4 minutes to look at the data individually. Using the ‘Global Impressions’ section, take notes on your graphic organizer. • Now, with your elbow partners, reflect on your ‘Global Impressions’
“Deep Dive” • PART 2—DIG IN: In groups…. • “Squint:” Bombed questions—did students all choose same wrong answer? Why or why not? • Compare similar standards: Do results in one influence the other? • Break down each standard: Did they do similarly on every question or were some questions harder? Why? • Sort data by students’ scores: Are there questions that separate proficient / non-proficient students? • Look horizontally by student: Are there any anomalies occurring with certain students?
Action Teach effectively what students most need to learn.
Time for Action • Basic Principles for Action • Plan-Develop new lessons based on data analysis • Action Plan-Implement what you plan (dates, times, standards, and specific strategies) • On-going Assessment-Conduct formative assessments, in the moment checks for understanding to ensure progress • Engage Students-Make sure students know the end goal, how they did, and what actions their taking to improve
Back to Pita and Creasy How did Creasy ‘Dive Deep’ into the data? What made Creasy’sanalysis effective? After a solid analysis, what made Creasy’saction plan effective?
Analysis into Action “The gunshot holds no fear.”
What is your plan of action for this group of students? What do you need to focus on? How are you going to do that? How will you know if they get it?
It’s all about good practice! Training
Discuss with your elbow partner: How does DDI fit in with PLC’s, Common Core, LFS, and Rigor, Relevance, and Relationships? Turn and talk with your partner about the interconnectedness of these initiatives.
It’s not about what you are teaching…it’s about what students are learning! Focus on Results!
The four keys to Data-driven Instruction • DATA-DRIVEN INSTRUCTION AT ITS ESSENCE: • ASSESSMENTS • ANALYSIS • ACTION • in a Data-driven CULTURE
Turn & Talk • How can we hold our teachers accountable for student growth while having them to reflect on best practices? • What are some of the excuses teachers use for students not making growth?
Video Analysis • How does this coach handle the situation when the teacher does not understand? • What did you notice about the coaching session? • What are you wondering?
Core Idea Data-Driven Instruction properly implemented does not require teacher buy-in – it creates it.
Data Driven Analysis Meeting Sort • Given envelopes with individual steps, sort the steps in the correct DDI category. • ASSESSMENTS • ANALYSIS • ACTION • in a Data-driven CULTURE
Analysis • Using the data set from earlier and the analysis of the data, you will prepare hold a coaching session. • Find successes, challenges, trends and root causes in the data.
It’s Meeting Time! • Numbered heads… • 1 -Teachers • 2 - Observers • 3 - Leaders • Observers and Leaders will swap off for With It or Not. The Observer is ensuring that all four of the steps are implemented. • Findings will be noted at the conclusion.
Did we achieve our goals? • Can you: • Identify the 4 critical components of DDI • Understand the connection between assessment, analysis, and action • Lead an individual data analysis meeting • Make connections between DDI and Colonial initiatives