Download
1 / 91
980 likes | 1.37k Vues
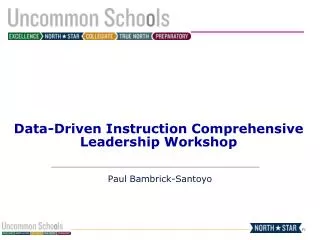
Data-Driven Instruction Comprehensive Leadership Workshop. Paul Bambrick-Santoyo. NY State Public School ELA 4 th Performance vs. Free-Reduced Rates. 100%. 90%. 80%. 70%. Pct. Proficient. 60%. 50%. 40%. 30%. 20%. 10%. 10%. 20%. 30%. 40%. 50%. 60%. 70%. 80%. 90%. 100%.

E N D
Data-Driven Instruction Comprehensive Leadership Workshop Paul Bambrick-Santoyo
NY State Public School ELA 4th Performance vs. Free-Reduced Rates 100% 90% 80% 70% Pct. Proficient 60% 50% 40% 30% 20% 10% 10% 20% 30% 40% 50% 60% 70% 80% 90% 100% Pct. Free-Reduced Lunch
NY State Public School ELA 4th Performance vs. Free-Reduced Rates 100% 90% 80% 70% Pct. Proficient 60% 50% 40% 30% 20% 10% 10% 20% 30% 40% 50% 60% 70% 80% 90% 100% Pct. Free-Reduced Lunch
Case Study: Springsteen Charter School, Part 1 • What did Jones do well in his attempt to improve mathematics achievement? • What went wrong in his attempt to do data-driven decision making? • As the principal at Springsteen, what would be your FIRST STEPS in the upcoming year to respond to this situation?
Man on Fire: • What were the key moments in Creasy’s attempt to help the girl (Pita)? • What made Creasy’s analysis effective?
ASSESSMENT ANALYSIS I • PART 1—GLOBAL IMPRESSIONS: • Global conclusions you can draw from the data: • How well did the class do as a whole? • What are the strengths and weaknesses in the standards: where do we need to work the most? • How did the class do on old vs. new standards? Are they forgetting or improving on old material? • How were the results in the different question types (multiple choice vs. open-ended, reading vs. writing)? • Who are the strong/weak students?
ASSESSMENT ANALYSIS II • PART 2—DIG IN: • “Squint:” bombed questions—did students all choose same wrong answer? Why or why not? • Compare similar standards: Do results in one influence the other? • Break down each standard: Did they do similarly on every question or were some questions harder? Why? • Sort data by students’ scores: Are there questions that separate proficient / non-proficient students? • Look horizontally by student: Are there any anomalies occurring with certain students?
Teacher-Principal Role Play • ROLE-PLAY ANALYSIS: • What did you learn about the teachers? • How did the interim assessment and analysis template change the dynamic of a normal teacher/principal conversation? • By using this particular assessment and analysis template, what decisions did the principal make about what was important for the student learning at his/her school?
Teacher-Principal Role Play • META-ANALYSIS: • What are the strengths and limitations of this approach to data-driven decision making? • What structures are needed to allow such a process to happen?
Videos of Teacher-Principal Conference Videotaped 2005-06
Impact of Data-Driven Decision Making North Star Academy State Test & TerraNova Results 2003-2008
HIGH SCHOOL HSPA—ENGLISH Comparative Data from 2008 HSPA Exam
HIGH SCHOOL HSPA—MATH Comparative Data from 2008 HSPA Exam
Day 1 Conclusions Data-Driven Instruction & Assessment Paul Bambrick-Santoyo
Day 2 Data-Driven Instruction & Assessment Paul Bambrick-Santoyo
Quick-Write Reflection • From what you know right now, what are the most important things you would need to launch a data-driven instructional model in your school?
THE FOUR KEYS: • DATA-DRIVEN INSTRUCTION AT ITS ESSENCE: • ASSESSMENTS • ANALYSIS • ACTION • in a Data-driven CULTURE
1. 50% of 20: 2. 67% of 81: 3. Shawn got 7 correct answers out of 10 possible answers on his science test. What percent of questions did he get correct? 4. J.J. Redick was on pace to set an NCAA record in career free throw percentage. Leading into the NCAA tournament in 2004, he made 97 of 104 free throw attempts. What percentage of free throws did he make? 5. J.J. Redick was on pace to set an NCAA record in career free throw percentage. Leading into the NCAA tournament in 2004, he made 97 of 104 free throw attempts. In the first tournament game, Redick missed his first five free throws. How far did his percentage drop from before the tournament game to right after missing those free throws? 6. J.J. Redick and Chris Paul were competing for the best free-throw shooting percentage. Redick made 94% of his first 103 shots, while Paul made 47 out of 51 shots. Which one had a better shooting percentage? In the next game, Redick made only 2 of 10 shots while Paul made 7 of 10 shots. What are their new overall shooting percentages? Who is the better shooter? Jason argued that if Paul and J.J. each made the next ten shots, their shooting percentages would go up the same amount. Is this true? Why or why not?
ASSESSMENT BIG IDEAS: • Standards (and objectives) are meaningless until you define how to assess them. • Because of this, assessments are the starting point for instruction, not the end.
ASSESSMENTS: LITTLE RED RIDING HOOD: 1. What is the main idea? 2. This story is mostly about: A. Two boys fighting B. A girl playing in the woods C. Little Red Riding Hood’s adventures with a wolf D. A wolf in the forest 3. This story is mostly about: A. Little Red Riding Hood’s journey through the woods B. The pain of losing your grandmother C. Everything is not always what it seems D. Fear of wolves
ASSESSMENTS: Subject-Verb Agreement • He _____________ (run) to the store. • Michael _____________ (be) happy yesterday at the party. • Find the subject-verb agreement mistake in this sentence: • Find the grammar mistake in this sentence: • Find the six grammar and/or punctuation mistakes in this paragraph:
ASSESSMENT BIG IDEAS: • In an open-ended question, the rubric defines the rigor. • In a multiple choice question, the options define the rigor.
ASSESSMENTS: • Solve the following quadratic equation: 2. Give the following rectangle with the lengths shown below, find the value of x: Area = 6
ASSESSMENTS: • PRINCIPLES FOR EFFECTIVE ASSESSMENTS: • COMMON INTERIM: • At least quarterly • Common across all teachers of the same grade level • DEFINE THE STANDARDS—ALIGNED TO: • To state test (format, content, & length) • To instructional sequence (curriculum) • To college-ready expectations
ASSESSMENTS: • PRINICIPLES FOR EFFECTIVE ASSESSMENTS: • REASSESSES: • Standards that appear on the first interim assessment appear again on subsequent interim assessments • WRONG ANSWERS: • Illuminate misunderstanding • TRANSPARENT: • Teachers see the assessments in advance
THE FOUR KEYS: • DATA-DRIVEN INSTRUCTION AT ITS ESSENCE: • ASSESSMENTS (Interim, Aligned, Reassess, Transparent) • ANALYSIS • ACTION • in a Data-driven CULTURE
THE FOUR KEYS: • DATA-DRIVEN INSTRUCTION AT ITS ESSENCE: • ASSESSMENTS (Interim, Aligned, Reassess, Transparent) • ANALYSIS • ACTION • in a Data-driven CULTURE
ASSESSMENTS: Reading Decisions • LEVELED VS. SKILLS: • Will your interim assessment develop around reading levels or reading skills?
Grade-Level Assessments PROS: • Predict results on external assessments • Measure student achievement against grade-level standard • Ensure school maintains high standards and expectation that all students will reach grade level CONS: • If a student is significantly behind in level, offers little information to inform instruction • Difficult to see incremental (monthly or quarterly) reading gains • Because text is often inaccessible to students, little data can be gathered on strengths and weaknesses by standard • Demoralizing for students to constantly fail Leveled Reading Assessments PROS: • Shows growth along the leveled-text continuum—possible to see monthly gains toward grade-level standard • Because the text is at an accessible level, gives data on individual reading standards • Motivates students and engenders student ownership of learning process • Confirms student reading levels for teachers • Assessment levels correspond to book levels CONS: • Does not predict results on external assessments • If not supplemented by grade-level assessments, could lower standards and expectations for the school Leveled Assessment Debate
ASSESSMENTS: Writing • RUBRIC: Take a good one, tweak it, and stick with it • ANCHOR PAPERS: Write/acquire model papers for Proficient and Advanced Proficient that will be published throughout the school & used by teachers • GRADING CONSENSUS: Grade MANY student papers together to build consensus around expectations with the rubric • DRAFT WRITING VS. ONE-TIME DEAL: Have a balance
ASSESSMENTS: High School • HIGH SCHOOL PROFICIENCY VS. COLLEGE READINESS: Preparing for HS state test and ACT/SAT/AP/college-level work • SOLID SHORT PAPERS VS. RESEARCH PAPER • MATH: Textbook vs. Application vs. Conceptual understanding
ASESSMENT ANALYSIS: Exercise • TASK: Compare State assessment with interim assessment • USE ASSESSMENT ANALYSIS SHEET TO ANSWER: • Are they aligned in CONTENT? What is the interim assessment missing? • Are they aligned in FORMAT/LENGTH? • Are they COLLEGE-READY expectations?
Case Study: Douglass Street School • Did Krista Brown meet the challenge of 15-point gains? What percentage of teachers do you think made the gains? Which teachers did not? Why? • Based on your answers, name the biggest stumbling blocks to school’s success. • Based on your answers, name the most important drivers of school improvement.
TRADITIONAL SYSTEMS: Principal-centered • HOW TO EVALUATE TEACHER EFFECTIVENESS: • How dynamic the lesson appeared to be • How well you control the kids • How good the curriculum guide / scope & sequence are (“well-intended fiction”—Jacobs) • “What is the real curriculum?” “The textbook.” • What the teacher teaches and how “good” their pedagogical choice was
DATA-DRIVEN CULTURE: • VISION: Established by leaders and repeated relentless • TRAINED LEADERSHIP TEAM: “real” leaders and formal leaders involved in process • CALENDAR: Calendar in advance with built-in time for assessments, analysis & action • PROFESSIONAL DEVELOPMENT: Aligned
THE FOUR KEYS: • ASSESSMENTS (Aligned, Interim, Reassess, Transparent) • ANALYSIS • ACTION • in a Data-driven CULTURE(Vision, Leadership, Calendar, PD)
Analysis, Revisited Moving from the “What” to the “Why”