Download
1 / 83
870 likes | 1.18k Vues
Understanding Chinese economy. Professor JIANWEI WU TONGJI University 2014. Map of P.R. China. Chinese economic features. Fastest growing economy in the world, GDP much larger than GNP, thanks for FDI Save more, invest more and consumer less

E N D
Understanding Chinese economy Professor JIANWEI WU TONGJI University 2014
Chinese economic features Fastest growing economy in the world, GDP much larger than GNP, thanks for FDI Save more, invest more and consumer less Hundreds million people swing between the East and West regions, or on the way A poor developing country with huge amount USD reserves, GDP per capita ranks the poorest 30%, while foreign currency reserve reached 3.82 trillion USD on 31, 2013 No luxury brand is designed by Chinese, most of them made in China and half of them shipped back to China 3
Chinese economic features One of the most polluted countries managed to produce solar and wind generators A socialist country trapped in monopoly industries, struggling to build market system GDP per capita is $6920 in 2013 Four wheels of the economy: cheap labor, open door policy, reform, urbanization; energy driven: from high saving rate to high rate of investment 4
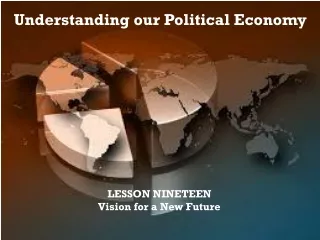
Introduction of Chinese macroeconomic environment, political factor Earliest market regime in the world Property heritage system formed an inward looking society Emperors Wen and Jing only taxed 1/15 to 1/30 of people’s income Leading roles of Chinese Communism party can be found in the various administration levels, real decision makers State and regional governments regulate economic affairs and share tax revenue – 49.4% to 50.6% in year 2012. 5
Extra 30% from selling land! Governments get 30% extra revenue from selling land 8
Economic and social factor of urbanization and mega cities • Economy of scale, scope, industrial cluster and economic networking • High value added industry in CBD: finance, services and entertainment • Face to face communication (dating and appointment), emotional needs, social networking • Tank of skills and talents • Employment and recruitment opportunities
Cardinal challenges and opportunities to modern Chinese economy are urbanization and employment Up to 53.7% of residents are categorized as city and town citizens and 46.3% as farmers, respectively in 2012. Hundred million youth migrates from inland China, particularly countryside to cities and coast areas, looking for jobs. More than 60% of the Chinese will be settled in urban area by year 2020. Therefore, there have to be enough jobs, shelters and infrastructure to accommodate new immigrates. Number of cities with one million or more population are 150 in China in 2010. 10
Labor force and employment • Working forces (age between 15-64) was 644 million in 1980 and 941 million in the peak year 2011. Labor force shrink 3.5 million since 2012. • The ratios of labor to total population are: 1980 64.4%; 2009 72.4%; 2030 67.4%; 2050 63%
Urbanization and road communication in China • Rapid train system, over 10000 Km and competing with airlines
(continued) The total turnover of cargos in harbors is 3.42 billion tons in 2006 and 9.47 billion tons in 2012. The national highway project “7918” will be constructed based on the planning of Ministry of Transportation, namely 7 routes radiating centered in Beijing, 9 North-South and 18 East-West rotes cross mainland China, making total mileage of 85000 km. All 319 cities which have population more than 200,000 will be connected in year 2020. 15
Widening distribution of income between coastal and inland, urban and countryside • The gaps of income between coast areas and inland China are huge and still enlarging. Gini coefficient was 0.28 in early 1980s, increasing to 0.38 in 1995, 0.458 in 2001 and over 0.47 in 2012. • Social stability, comparison between China, India and Brazil (0.515 in year 2008) • Disposable income per person in cities and towns were RMB8472 in 2003, 26955 in year 2013. By contrast, average net income of rural residents was only RMB 2622 in 2003; 8896 in year 2013 . • Social welfare coverage is close to 100% but at very basic level
Everlasting unemployment issue • Because of limited arable land, people ages between 15 to 50 move to cities to find jobs. • Left home ages and children, not only an economic issue • The hidden unemployment is a serious problem, but it provides abundant supply of labor. • Supply of employment posts in the near future should come from the service sectors and near major cities. • The development of Chinese industry has constraint of shortage of skilled labor
Industrial performance in year 2005 and 2013 • Electricity bn KW/hour, 2474.7 to 5397.6, shortage • Coal mn tons, 2190 to 3680, transportation problem, slowing down • Steel mn tons, 352 to 779, over capacity and constrained on ores importing • Cement mn tons,1060 to 2420, pollution • Car million, 5.7 to 22.12, mild growing • Construction value added bn, 690 to 3900, demands slow in real estate and more on infrastructure
(con’t) • Investment for real estate bn, 1543 to 8601, growth rate slowing down • Consumer retail 6718bn to 23781bn, booming sector • Saving in financial institutes 30 trillion to 94.3 trillion, slowdown since year 2010 • Money supply of M2 29.9 trillion to 110.7 trillion. hard to get loan • China is facing the threaten of the bubble economy and deflation
GDP in 2011, where does fuel come from? GDP = C + I + G + (X – M)=49.1(C+G)+48.3(I)+2.6X High level of saving in banks, liquidation mismatch problem, SME is hunger for loan, loan for the poor (Shanghai miracle in the 1920s and Bangladesh country banks) Insufficient development of financial market, bond and other security markets Less enthusiasm of consumption Overheating of regional government investment and expenditure Underground economy Surging in foreign currency reserve, over export and flowing in speculative money Price index and interest rate 26
Continuous growth of Chinese economy • Divergent interests of central government versus regional governments, increasing gaps of development • Potential of the service industry: the road from secondary position to leading sector of GDP; value of emotion and information, from GE to IBM, from physical manufactures to the new economy • Resurging of commodity economy, materials and agriculture and economic products • Further opening up industrial sectors to private and foreign investors • Why do we need a ever growing model, pollution also cost 10% of GDP
A long way from OEM to ODM and self-owned intellectual property • The cost of intellectual property, barriers for catching up economies, overwhelming patent applications from the overseas • Emerging of ODM in the coast regions • Insufficient input on R & D, case of the Chinese pharmaceutical industry • Lessons learned from pattern of development in South American
Can growth of Chinese economy rest on soaring prices of raw materials in the global markets? • Sustainability of resource-based model in China • Who enjoys large stake of economic fruits: China, MNCs, developed countries, resource-rich nations? • Political, environment and financial risks and challenge for Chinese firms through mining in the overseas
Global value chain and ladders • Material supplied in resource rich countries • Processing nations • Assembly basis • Call centers • Logistic and harbors • Trading centers • Financial centers, monetary markets: gold, currency issue and circulation, FX market
Global value chain and ladders • R & D centers • Information processing centers: software, media, culture products • Design centers • Industrial code and standards: visa group • International organization • Value circle, environment friendly production
Chinese energy industry • Choosing a right industry is the key of business success in emerging economies • The energy industry in China: bottleneck or business opportunities • What business opportunities can you observe from the growing demand for energy supply in China: investment for shares listed in the major stock markets, consulting, technology transfer, trading in oil, environment protection?
The rapid development of automobile industry, acceleration of urbanization Cars manufactures have been growing dramatically • Causing sever problem of traffic congestion. • Lifestyle changing and urban spending • Limited space of parking space in residential blocks and CBD • Vehicle purchase, tariff and toll gates, experience in Sydney
Housing price and income ratio in Shanghai Price per SQ meter: Inner circle 55518; middle 29281; out circle 16541 47